
[widget id=”text-19″]
2019 is nearly here, and that means it is time to roll out my ten predictions for the new year. As I did last year, I will start with number 10 and work our way up to number 1 over the last month of 2018. Enjoy!
Prediction #8 – The U.S. 10 Year Treasury Yield Falls to 2.3% in 2019
It may sound unimaginable, but U.S. Treasury yields may fall in 2019 to as low as 2.3%. Sure it seems crazy, but then again, it looked mad last year when at this very same time I said oil would increase to $75, inflation would rise to 3%, and the 10-Yield would increase to 3%.
It is About the Global Spread
There are reasons why the yields will fall, and they are not because a recession is looming. It is because of the spreads between the US and global bond yields. One needs to look no further than the US and German spread. Today the spread between the US and German 10-year bonds are at their highest levels since 1988! Yes, 1988, look at the chart.

This may be the very reason alone why rates on the 10-year and longer-dated maturity are falling. The German Bund currently yields just 25 basis points. British bonds, even with all the uncertainty of Brexit yield only 1.05%, Spanish bonds yield 1.45%. Which countries bonds would you rather own?
Technical Charts
The technical setup for the 10-year also suggests that yields fall. The technical pattern in the stock is a rising wedge, a bearish reversal pattern. Should yields fall below 2.80%, the next level of support would come at 2.6%, and then 2.3%.
The 10-year treasury has been in a deep, long-term downtrend since the late 1980s. The 10-year treasury rate is at the downtrend which is acting as resistance.
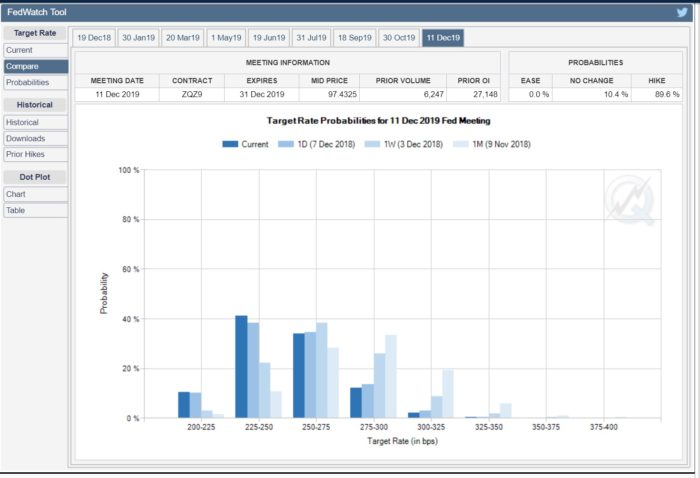
The Fed
Fed Rates hikes in 2019 are becoming uncertain. The latest data suggest that there is now a 42% chance there are NO RATE HIKES next year and 32% chance of ONE RATE HIKE. On November 9, there was a 20% chance for three hikes, 33% chance for two rate hikes, a 28% chance for one hike, and an 11% chance for no hikes. That is a significant change in just one-month time.

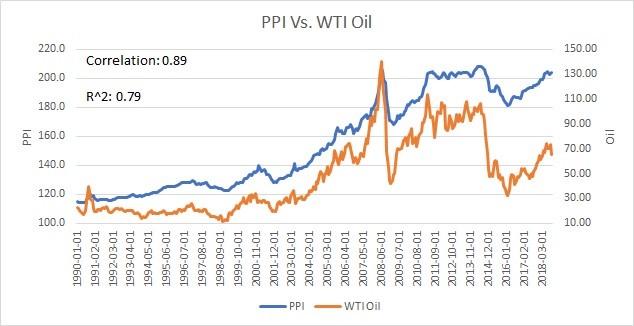
Where’s the Inflation
Additionally, oil prices have collapsed, and history shows that the price of oil and critical inflation gauges such as the producer price index are highly and statistically significantly correlated.

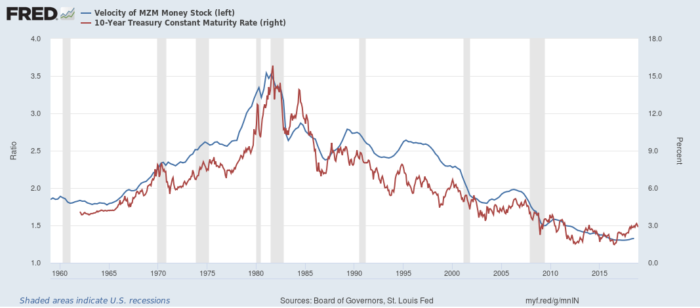
Velocity of MZM
Additionally, a gauge I love to use is the velocity of MZM, which is nominal GDP divided by the MZM money supply. This indicator continues to suggest that inflation is very low and that the creation of $1 in MZM creates just $1.32 in GDP. In the 1980s, $1 in MZM created $3.2 in GDP.

All of this continues to suggest that 10-years are going lower, not higher in 2019.
In all, it makes may likely mean that the 10-Year Treasury is heading lower and Prediction #8 for 2019.
Mott Capital Management, LLC is a registered investment adviser. Information presented is for educational purposes only and does not intend to make an offer or solicitation for the sale or purchase of any specific securities, investments, or investment strategies. Investments involve risk and unless otherwise stated, are not guaranteed. Be sure to first consult with a qualified financial adviser and/or tax professional before implementing any strategy discussed herein. Upon request, the advisor will provide a list of all recommendations made during the past twelve months. Past performance is not indicative of future results
rates, fed, velocity, mzm, yields, bunds, bonds