

FEBRUARY 21, 2020
STOCKS: AMD, ROKU, MSFT, BABA, GILD
MACRO: SPY, DOLLAR, YIELDS
MICHAEL KRAMER AND THE CLIENTS OF MOTT CAPITAL OWN MSFT
MICHAEL KRAMER OWNS SPY CALLS
Join me on February 27 at 12 PM ET for a FREE webinar hosted by Interactive Brokers. I will cover why I think the S&P 500 is rising to 3,600. Sign up
Stocks sold off for a second day in a row and being an options expiration Friday certainly didn’t help. Still, the sell-off, which can feel uncomfortable to some, still doesn’t fell worth of a freak-out to me. Consider, the S&P 500 is down about 1.8% since the peak on Wednesday. Is the next correction or end of days upon us, still most likely not.
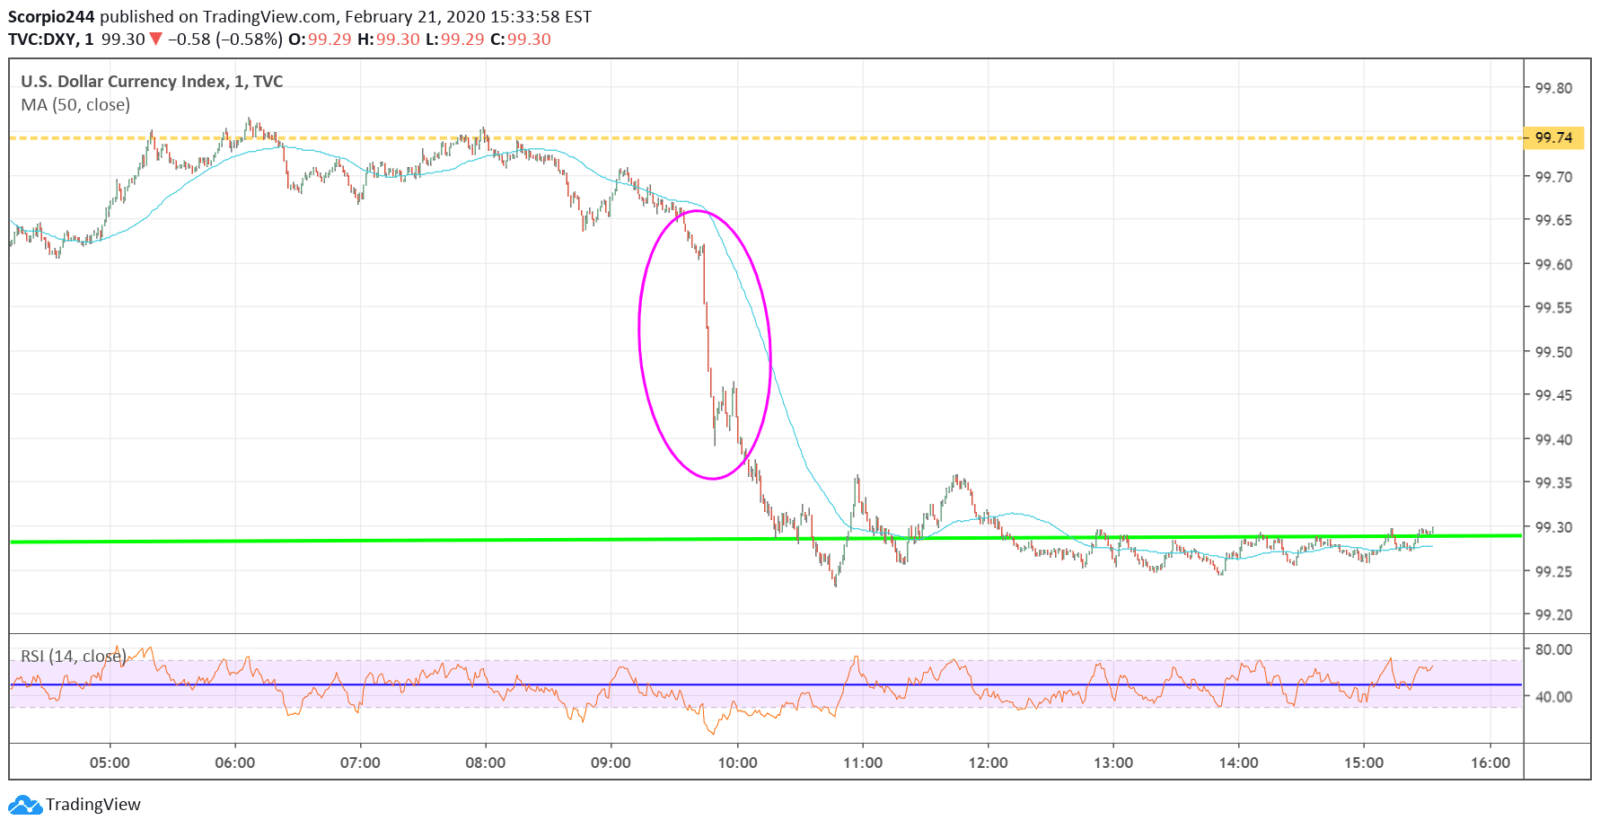
Today, the services flash PMI kind of got things moving in the wrong direction. The reading came in at 49.4, which was well below the estimates 53.3. That weak reading got yields and the dollar moving lower and put the equity market sell-off into overdrive.
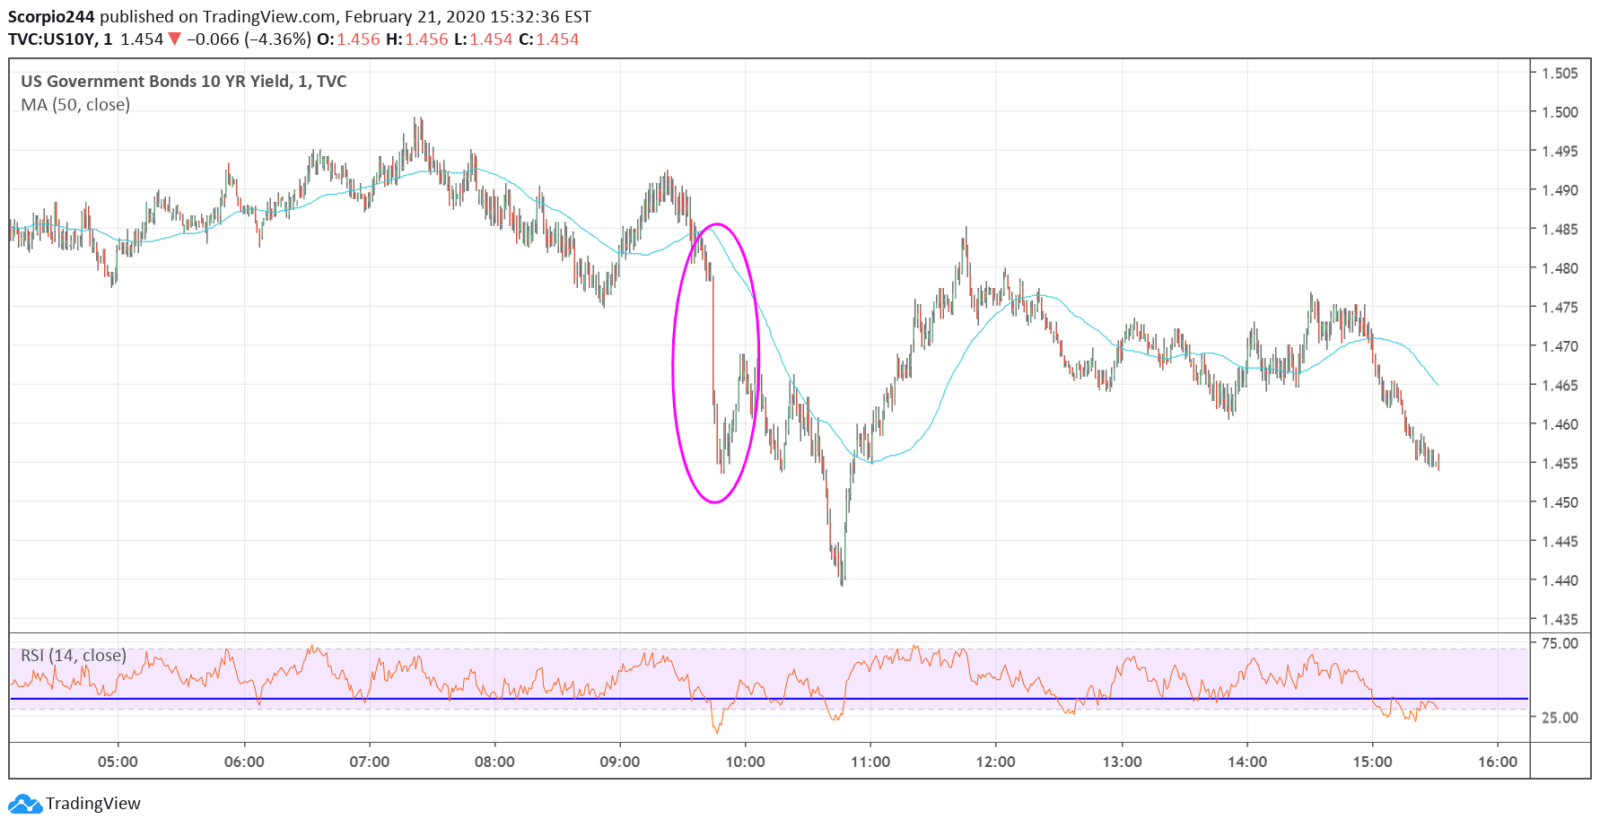
You can see the same reaction in the dollar at the same moment in time.
Stocks were already weaker, but any hope of recovery was dismissed.
The weak flash services number certainly was surprising, I really can’t remember the last time anyone even paid attention to this number, and honestly, it just seems like such an odd report.
Regardless, at this point, the decline has been somewhat tame, falling by 1.7% so far, which should not come as a surprise to anyone given the index had been up 5.4%. Even with the pullback, the S&P 500 is up about 3.9% since the January 31 low. So whatever, that’s my feeling.
Besides, there were falling wedges, double bottoms, and rising wedges all over the place.
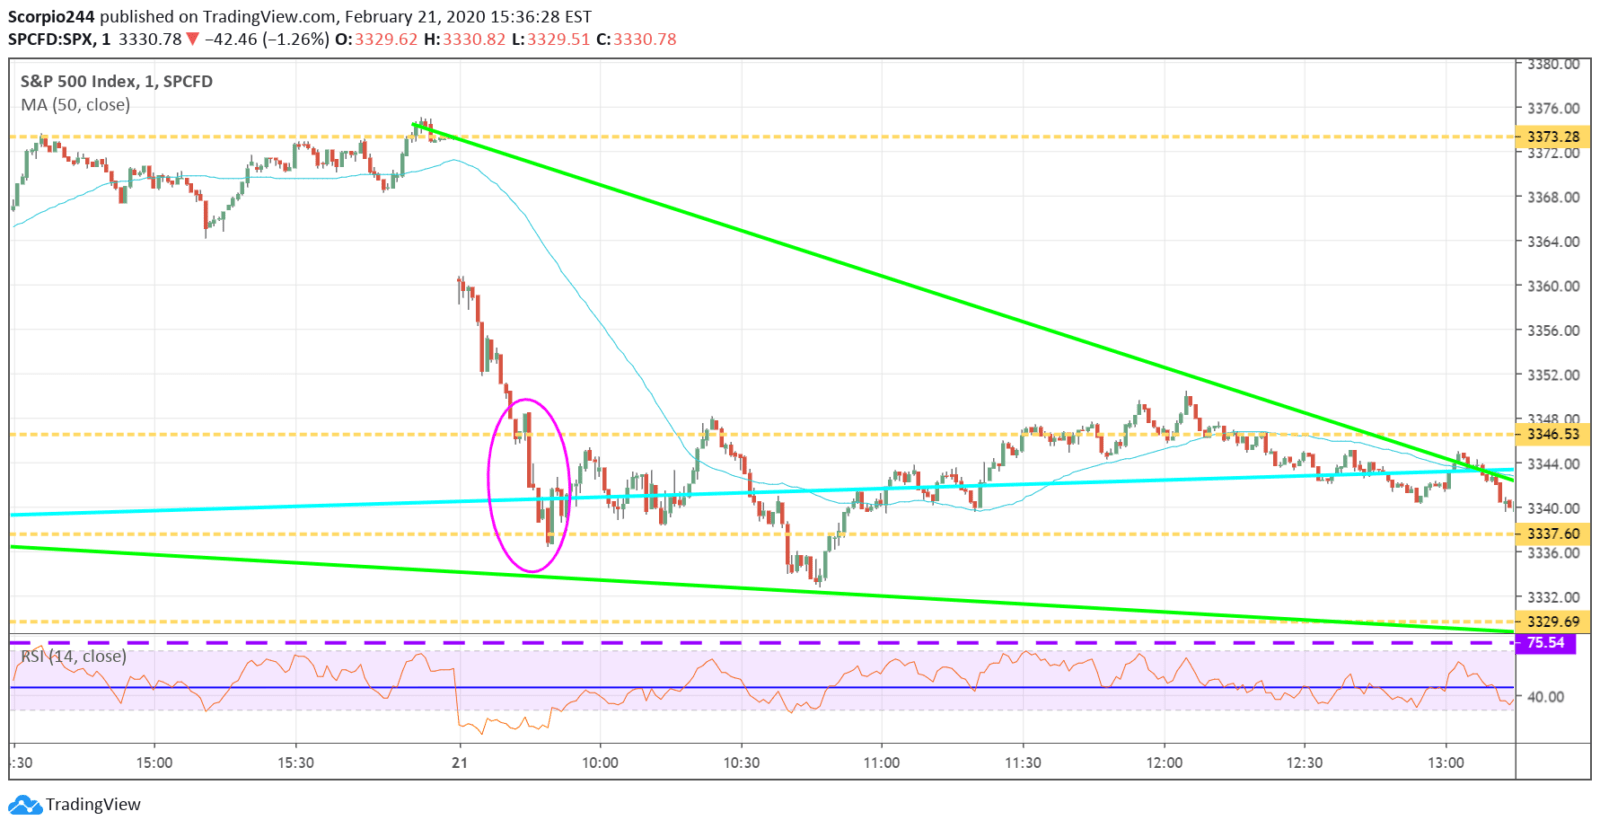
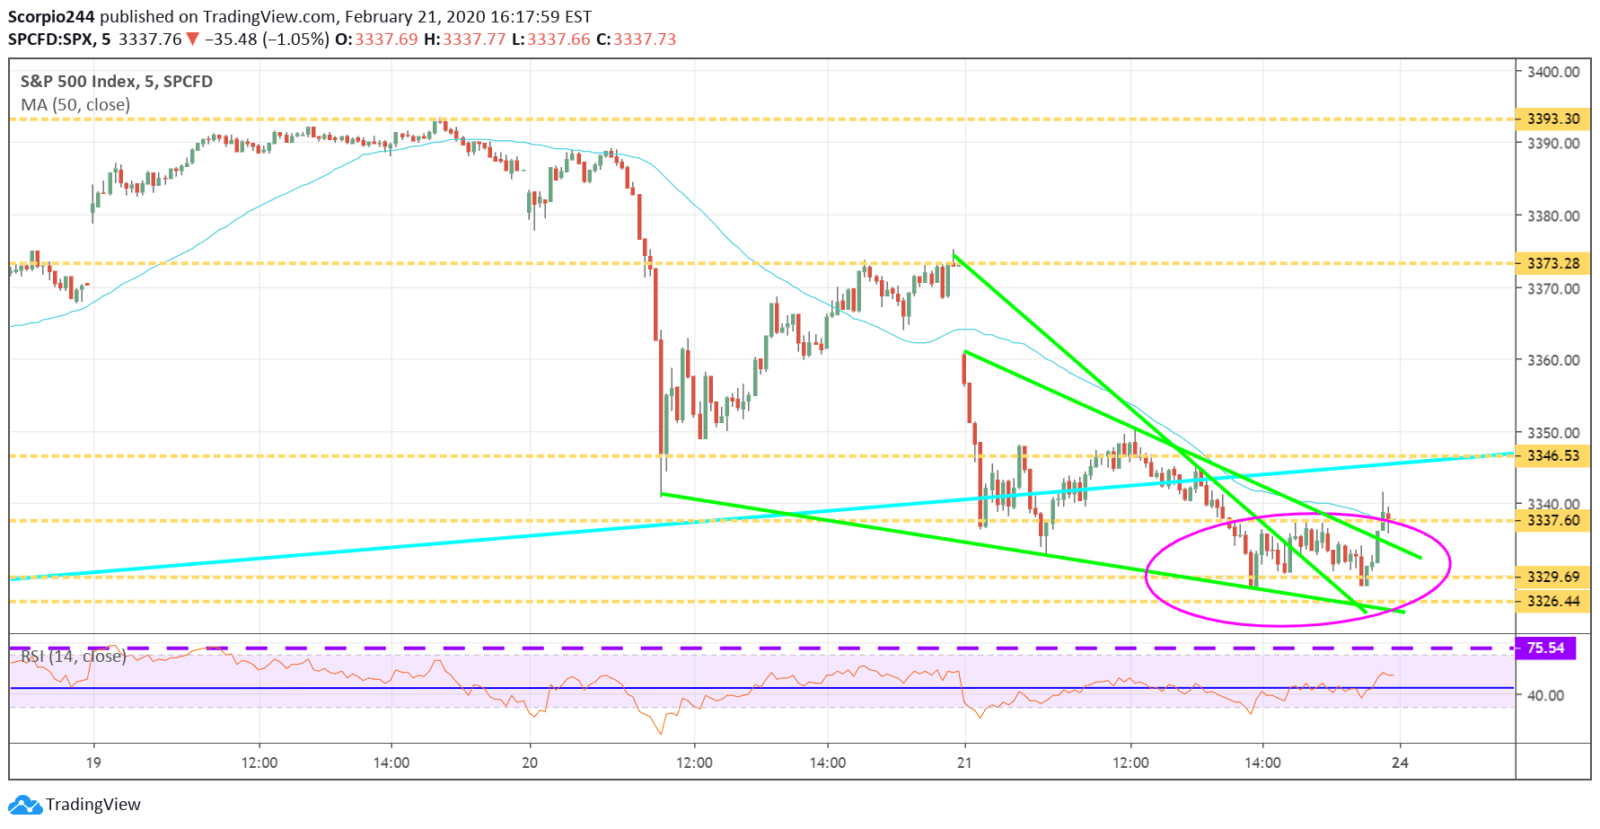
S&P 500 (SPY)
You can see in this chart that there are two falling wedges, a bullish reversal pattern, and a potential double bottom, another bullish reversal pattern, on the chart of the S&P 500. A retest of 3,329 on Monday morning would be perfect, followed by a big run higher.
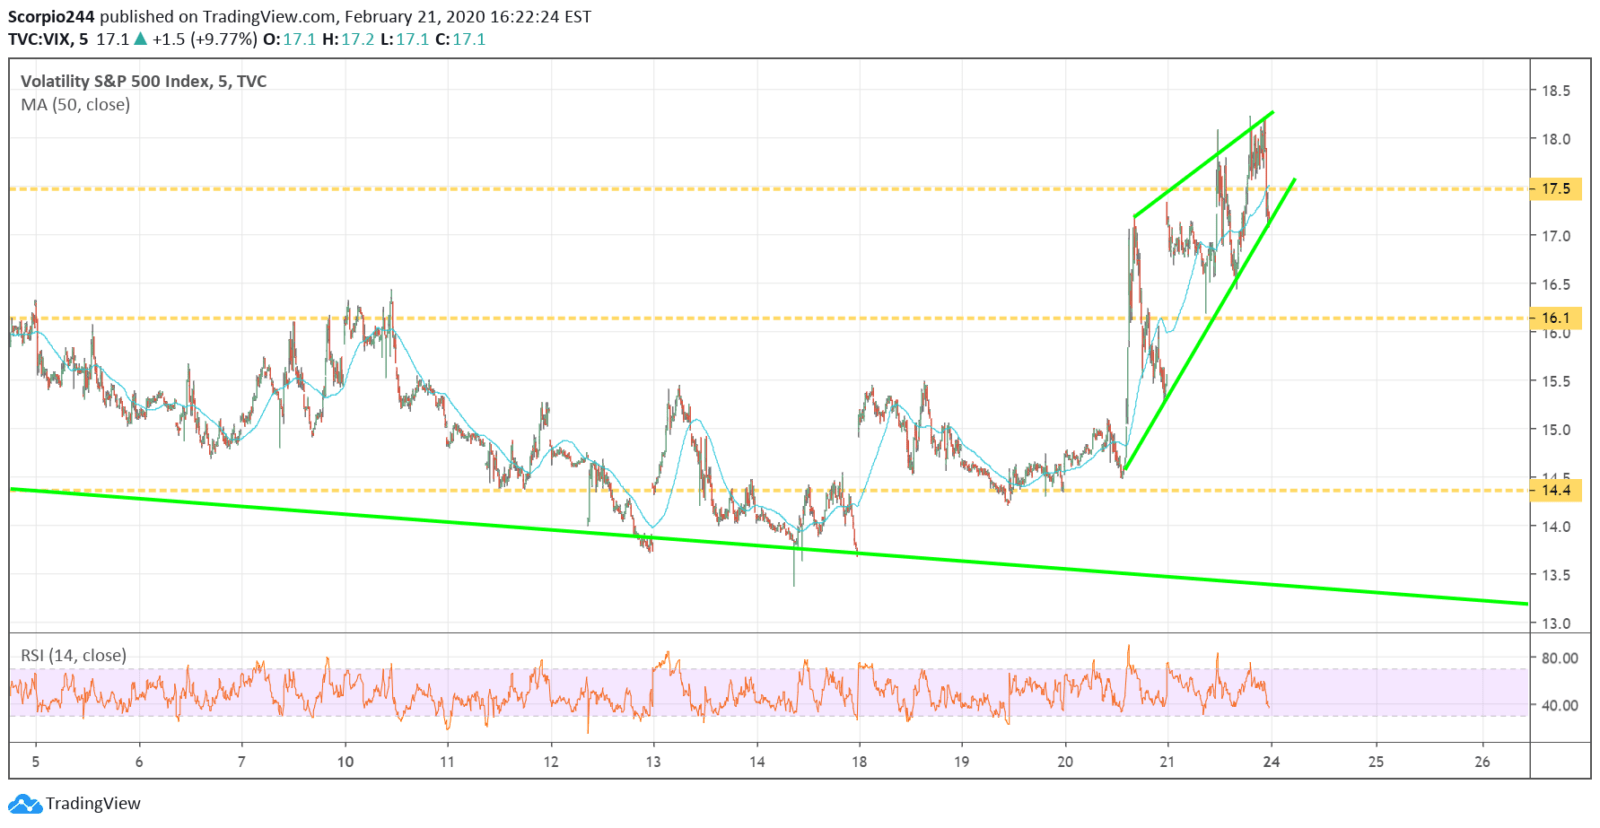
VIX
Then there is a rising wedge pattern in the VIX, a bearish reversal pattern.
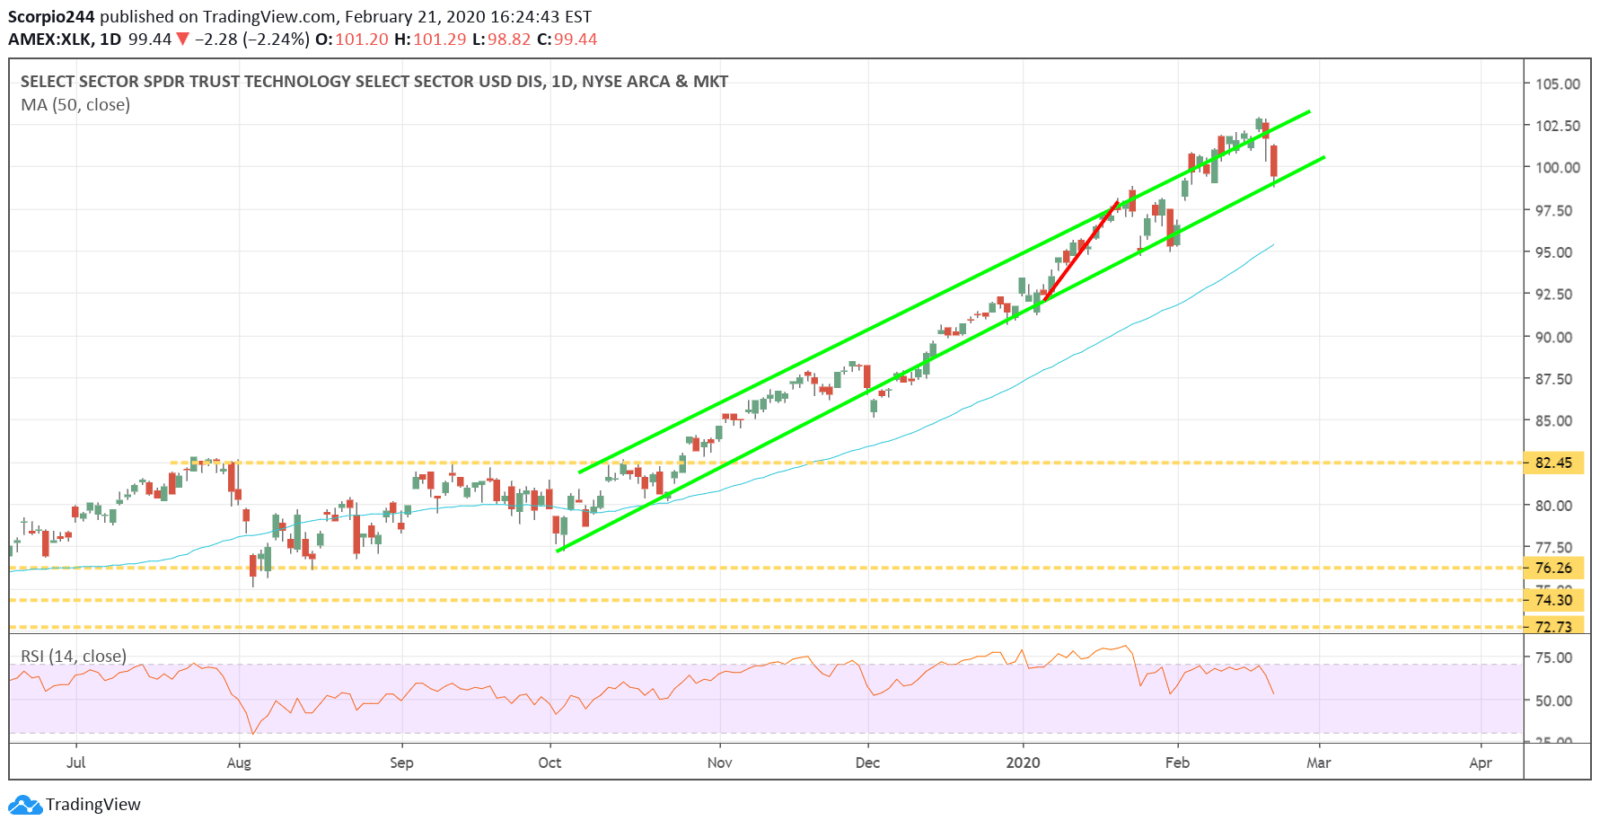
Technology (XLK)
The technology ETF fell back to the bottom of the trading channel.
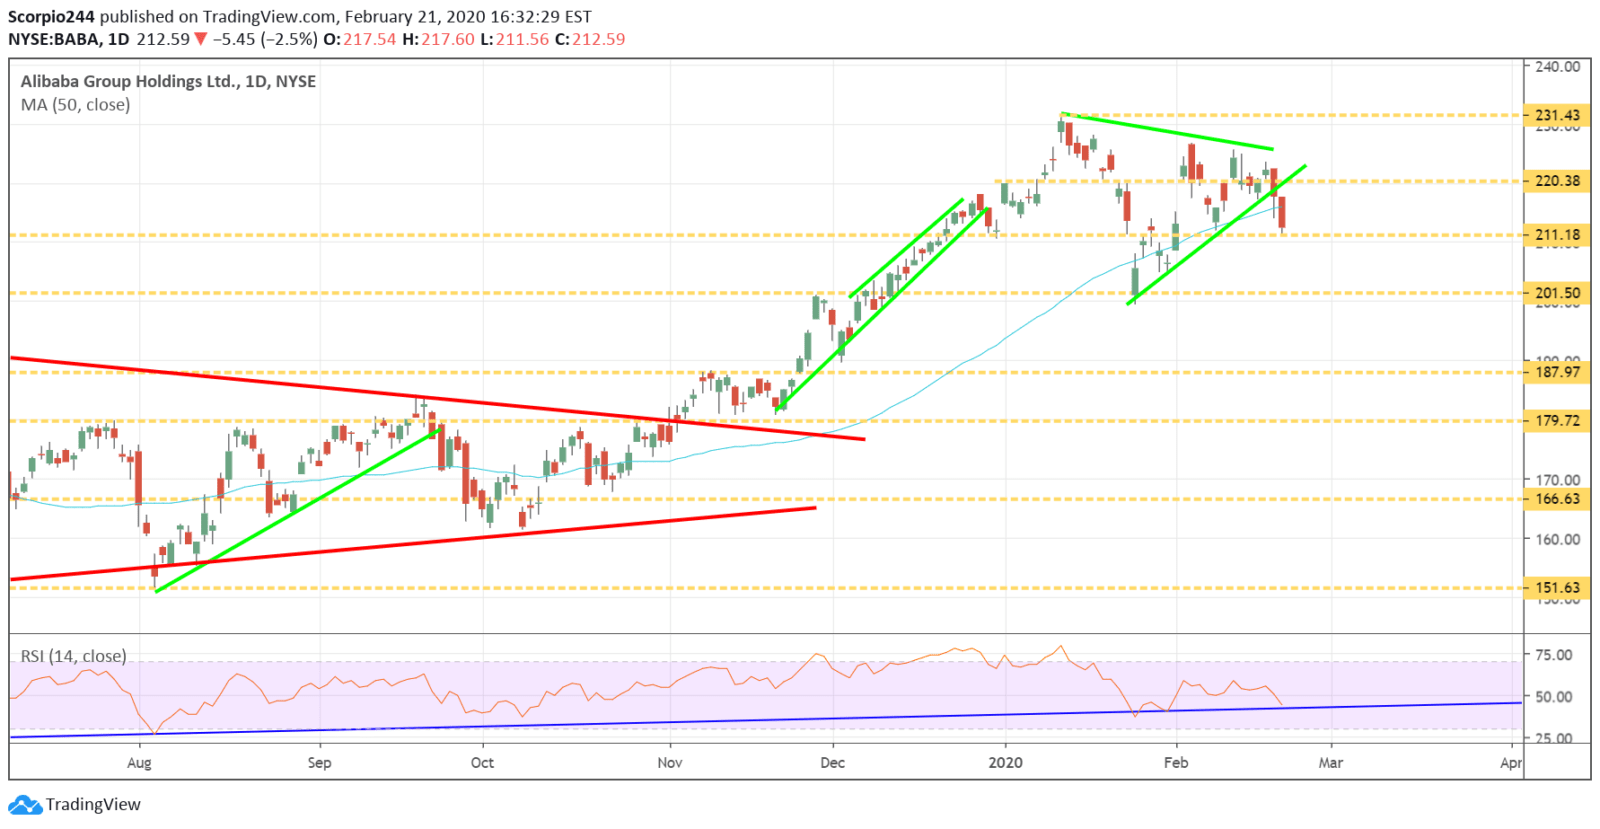
Alibaba (BABA)
Alibaba fell out of the triangle but found support at $211. It is a tough call what happens next, but the overall trend in the RSI is higher still, so let’s go with the view that the stock can at least rebound to around $220.
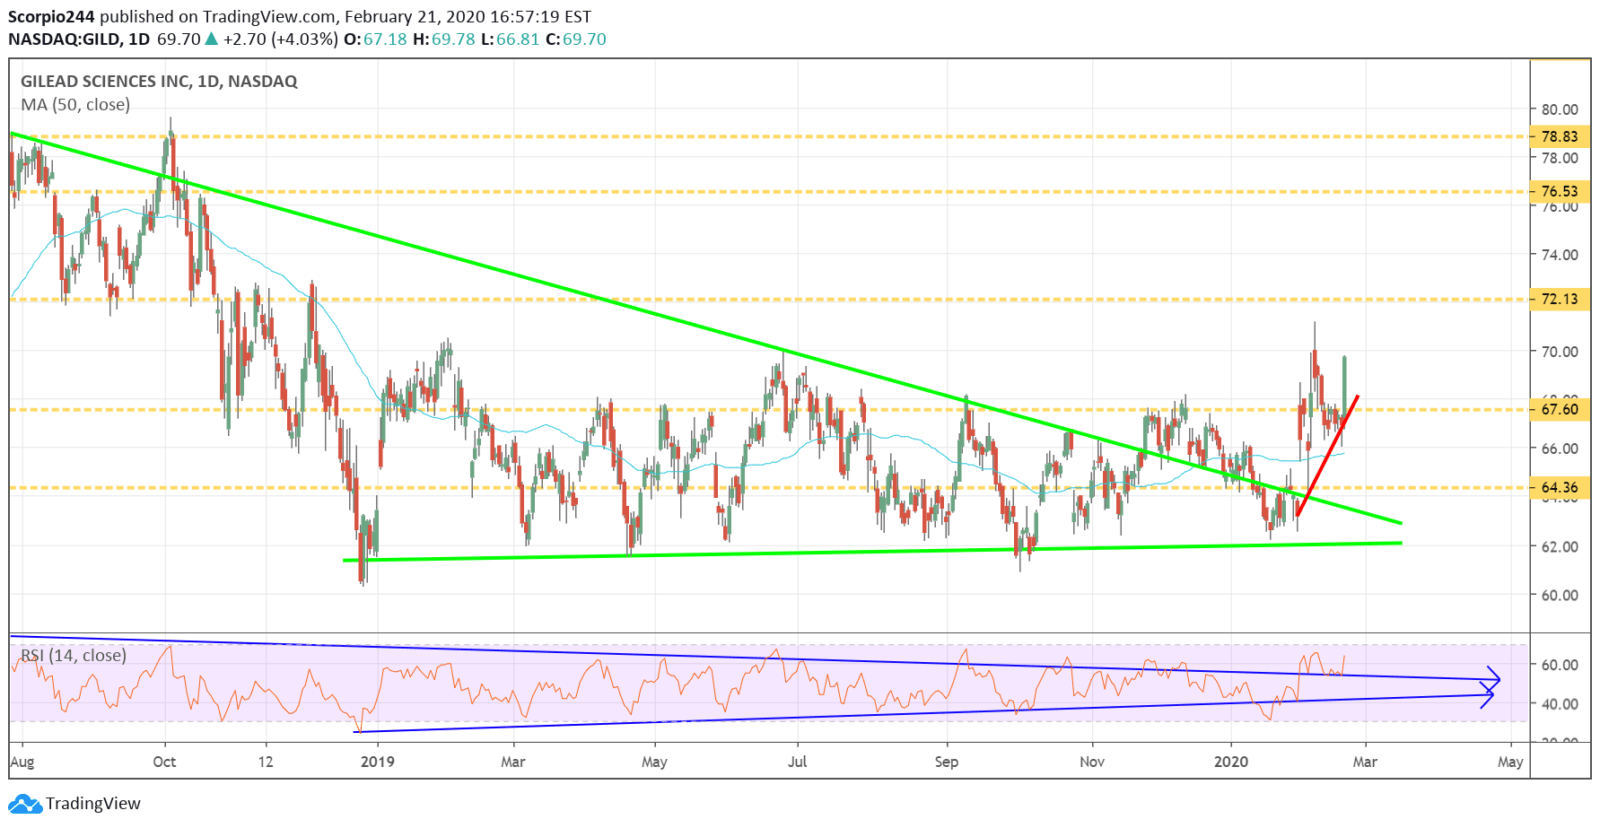
Gildead (GILD)
I have been watching Gilead a lot lately, and the trends seem to be there on the RSI to indicate that shares may be heading higher. The stock is trying to break out, and it appears to be close. Now, if it can clear $72, that would be even better.
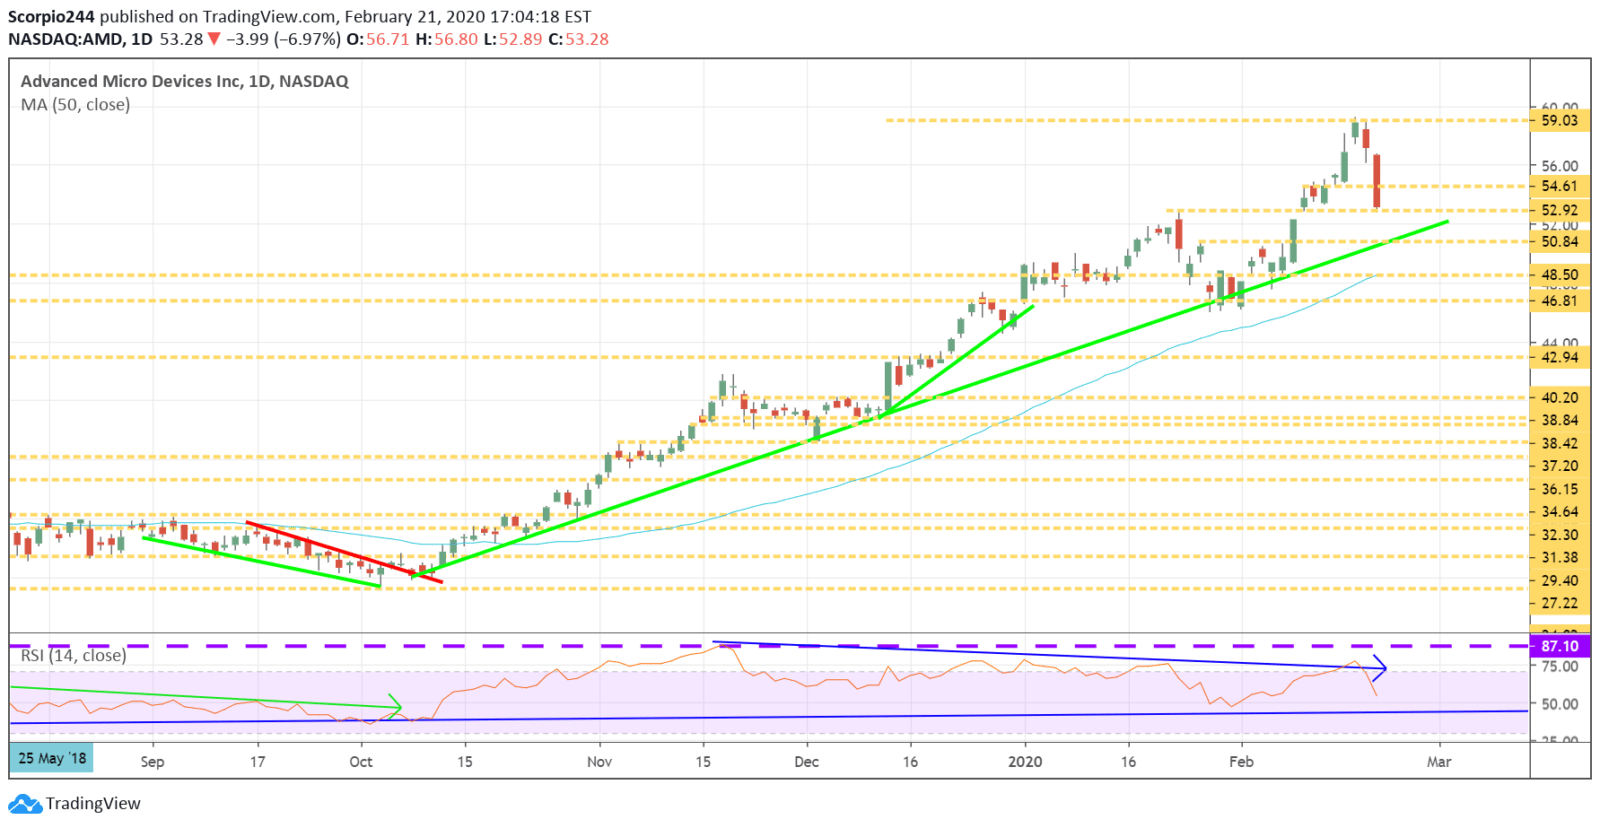
I looked at AMD again after the close, and it could still have some further to drop. The RSI is trending lower and the uptrend doesn’t come until $50.75, so lets go with that. Anyway, there were over 200 comments on my latest AMD article, and I can bet that the majority said that I was crazy when I wrote it. You know how I know, because after two days of an insane of notifications on AMD, today there were hardly any. I guess I wasn’t crazy. 😛 AMD’s Massive Rally May Be About To End
Microsoft (MSFT)
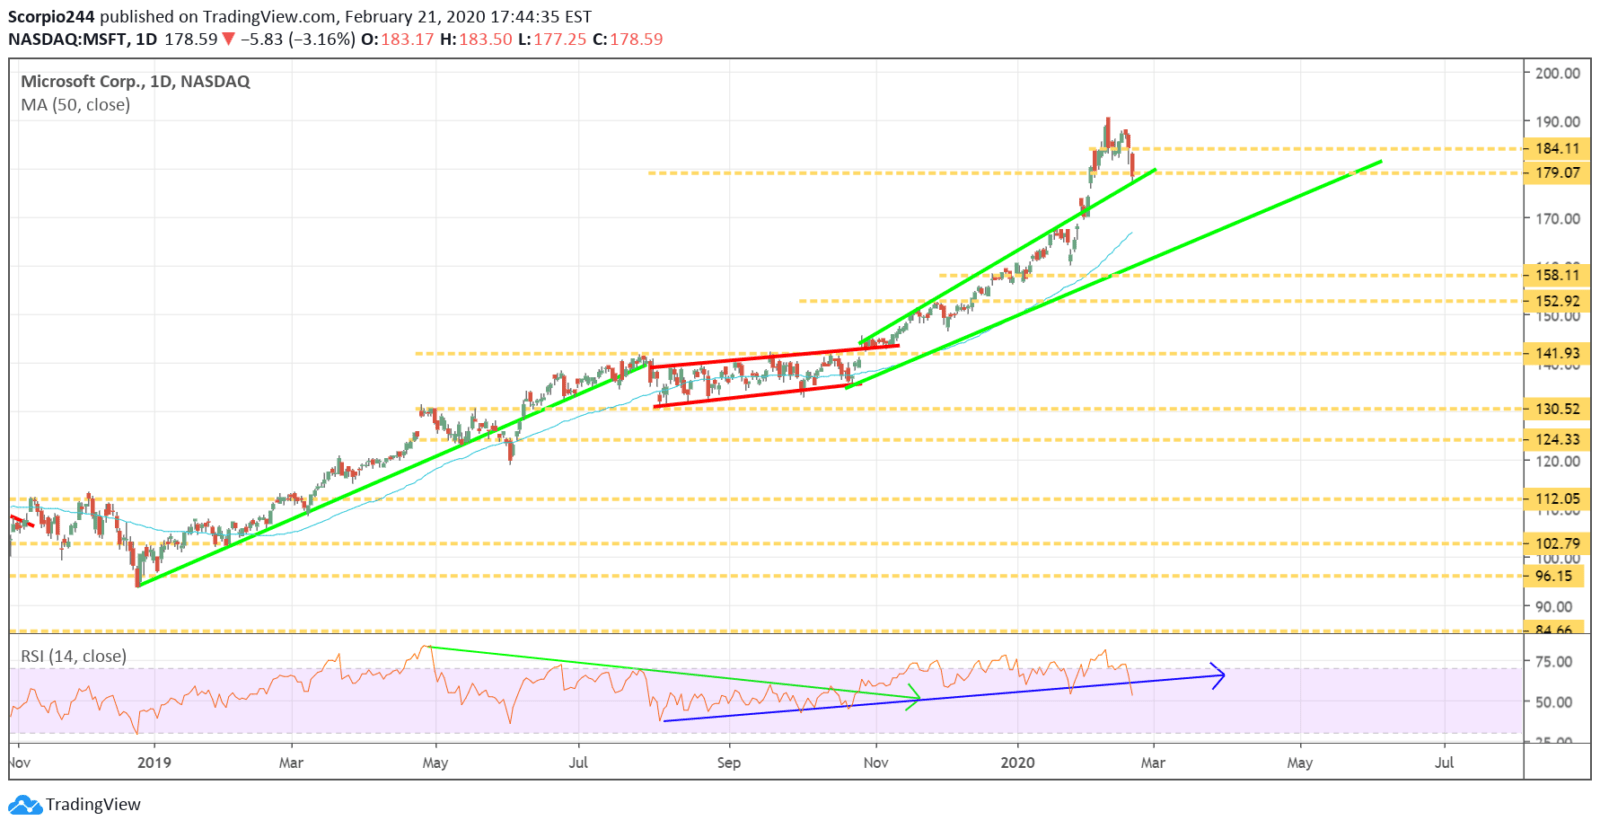
But look, I can be wrong from time to time. Right now, my call for Microsoft going to $200 isn’t looking so hot. A break of $179, probably pushes the stock back to $170. More Signs The Microsoft Rally Will Continue
Roku (ROKU)
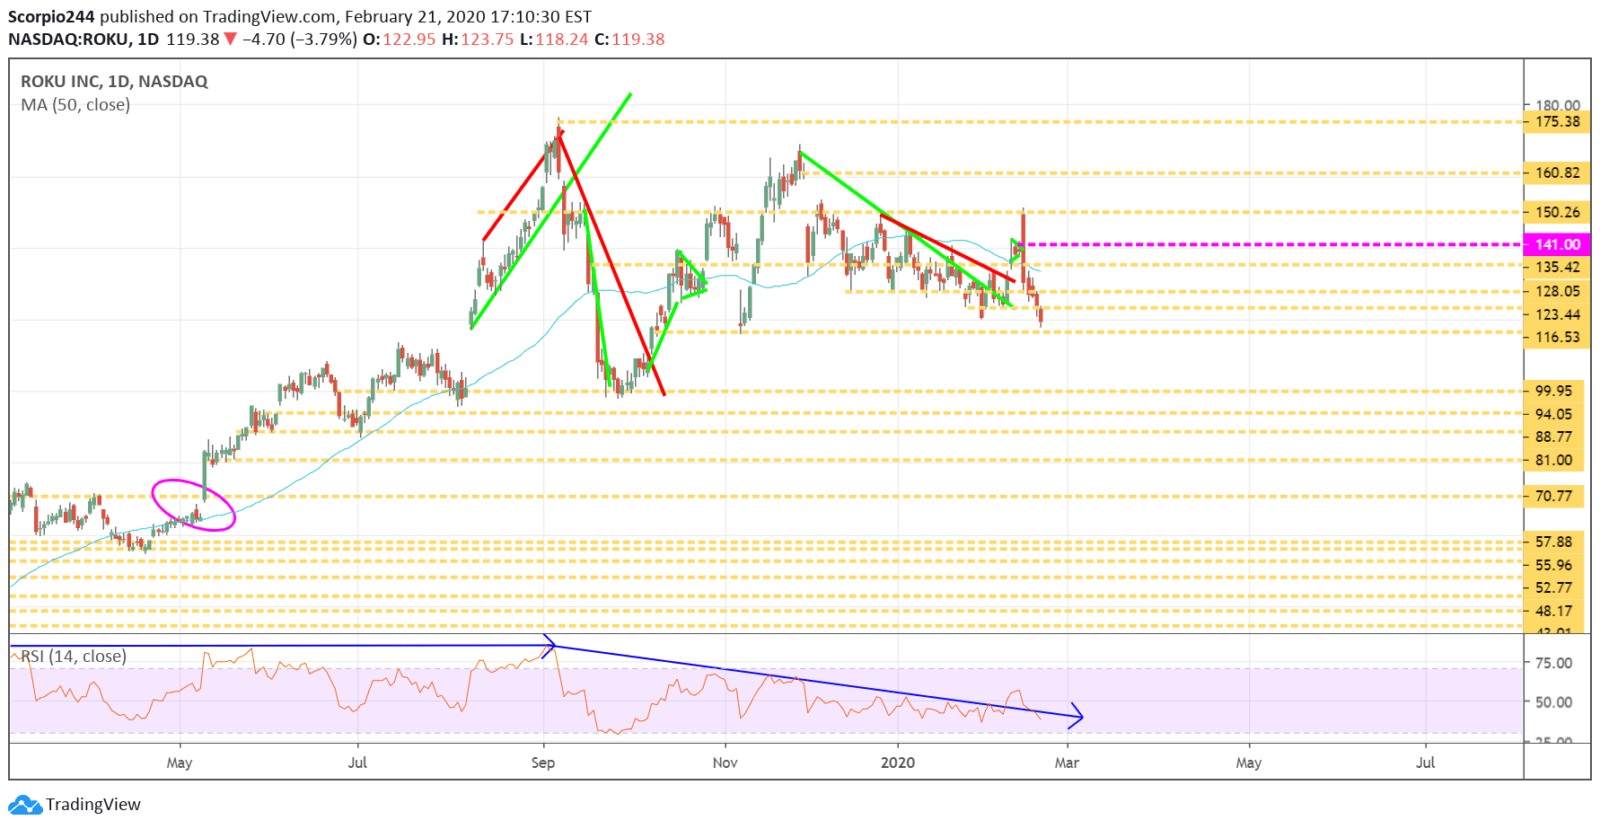
ROKU keeps drifting lower, and now as $116 approaches, you have to wonder if $100 isn’t far behind.
-Have a great one
-Mike
Mott Capital Management, LLC is a registered investment adviser. Information presented is for educational purposes only and does not intend to make an offer or solicitation for the sale or purchase of any specific securities, investments, or investment strategies. Investments involve risk and unless otherwise stated, are not guaranteed. Be sure to first consult with a qualified financial adviser and/or tax professional before implementing any strategy discussed herein. Upon request, the advisor will provide a list of all recommendations made during the past twelve months. Past performance is not indicative of future results.