

4/14/20
Stocks Plummet as Pandemic Shuts The Global Economy
For the first quarter, the Mott Capital Thematic Growth Composite (including fees and transaction costs) fell by 16.7% versus an S&P 500 Total Return (inclusive of dividends), which dropped by 19.6%, and the S&P 500 (exclusive of dividends) decline of 20.0%.
Thematic Growth Composite Performance
|
Thematic Growth Composite -16.7% |
S&P 500 Total Return Index -19.6% |
S&P 500 Index -20.0% |
Preservation of Capital
As a result of the S&P 500’s sharp and unprecedented decline, falling by as much as 35% from peak to trough. I have taken steps to preserve the value of our accounts while putting us in a position to initiate new positions at a later date.
Due to these actions, cash balances across accounts rose to roughly 35-40% from our prior balances of 5-10%; this is how I hedge the portfolio. I typically do not rebalance positions or shift from one asset class to another. During times of considerable uncertainty, I simply increase our cash position to buffer the effects of the broader market. My goal at this point is not to add risk exposure, but to decrease it.
Changes
Instead of the usual list of 3 best and worst-performing stocks, I am just going to run through the shares we have sold, and the stocks that we retained.
Sold: Cisco, Disney, Diageo, Netflix, NXP Semiconductor, Splunk, and Skyworks.
Remain: Apple, Acadia, Alphabet, Mastercard, Microsoft, Tesla, Unilever, and Verizon
I did sell Netflix this quarter, with the plan to repurchase it at some point. I saw this as an opportunity to reset our cost basis and have some losses to pair off against that gain. I do have a list of stocks that I plan to replace the other names with, but that will be done slowly over some time, as I grow more confident in the economic outlook for the country.
The names that remain in the portfolio all have unique positions in the economy, and I felt that the impact of the virus is likely not to disrupt these companies’ longer-term positions or themes.
Coronavirus World
By now, all of us have become familiar with the coronavirus. To me, the virus seemed threatening from the beginning, but with a lack of trustworthy information coming from China, it appeared the virus might resemble something like a bad flu season. The actions that were taken by the Chinese to lock down an entire country for weeks and a region for months seemed severe, and something that only a communist authoritarian government would carry out. Never would I have guessed that similar measures would be implemented here in the U.S., nor did some of my older and far wiser friends.
Post-Coronavirus World
The coronavirus will hopefully move fast and will spare as many people as possible. But the damage that has been caused to the economy I fear is profound and will not heal as quickly. The notion that the economy will just open up on a particular day a few weeks from now, and that life will return to what it was in February 2020, is not on the horizon for the foreseeable future, in my opinion. I do fear that a new normal is upon us until a vaccine can be developed or a therapeutic that is effective can be created. There is both an economic and psychological impact of these events.
Jobs Losses Are Staggering
In just three weeks, nearly 17 million American’s have filed initial claims for unemployment. With approximately 3 million people already on unemployment, as of today, there may be as many as 20 million people out of work, representing an unemployment rate of around 13%. What is more, worrisome is this number is likely to increase.
Swift Action
The Federal Reserve and the U.S. Government have taken incredible steps to ensure that the markets function smoothly, that businesses are advanced the funding they need to remain open and that the unemployed have a check coming. However, I fear that these interventions will not be enough. Ask yourself the simple question: how long will you wait to go out for your next dinner, your next trip to the movies, or book your next flight to a Disney park if the virus is still in the background? For the safety of my family, friends, and neighbors, I will be participating in these activities at a limited rate until I feel that I am completely protected from the virus, or at least that the threat is significantly muted. I am sure many share my concerns.
For these reasons, I fear the recovery will be much slower than most investors think. The Fed can create infinite supplies of money, but that money is worthless if it isn’t used to purchase something. If a company has no sales, it has no money to pay its employees, to pay its fixed cost, or to keep current on its interest expenses. The Fed and Treasury can continue to support these businesses, but for how long and at what cost? Our country would resemble something more of a communist, socialist state and not the capitalist country we are supposed to be.
Earnings May Decline Sharply
My base case assumption is that the earnings for the S&P 500 will decline by roughly 30% in 2020, and perhaps rebound by 20% in 2021. Currently, my earnings models have been moving in these directions. These types of declines and rebounds are what we have seen in past recession since the early 1990s. Based on this, I feel the fair value for the S&P 500 may only be 2,300 to 2,400. That is a significant shift from where I stood to enter 2020 when I had beliefs the S&P 500 could rise to 3,600, but that was before the virus.
The first quarter was unprecedented in the speed and the severity of the stock market decline. The equity market has rebounded some in recent weeks, but I feel that this is merely part of the current period of volatility and that equity prices will settle at slightly lower prices over time. But we may continue to witness a period of sharp swings up and down for some time longer.
As in the past, I will work my hardest to understand the current investment landscape, while continuing to identify new long-term thematic strategies shaped by generational and demographic shifts.
As always,
-Mike
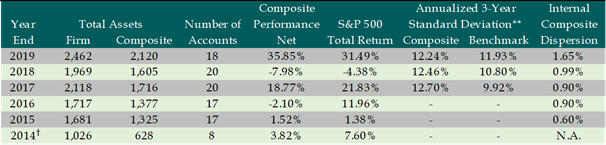
N.A. – Information is not statistically meaningful due to an insufficient number of portfolios in the composite for the entire year.
† Performance reflects the non-annualized performance from 8/1/2014 to 12/31/2014.
** For periods with less than 36 months of composite performance, no 3-year ex-post standard deviation measurement is available.
Disclosure: Mott Capital Management, LLC is a registered investment adviser. Information presented is for educational purposes only and does not intend to make an offer or solicitation for the sale or purchase of any specific securities, investments, or investment strategies. Investments involve risk and unless otherwise stated, are not guaranteed. Be sure to first consult with a qualified financial adviser and/or tax professional before implementing any strategy discussed herein. Upon request, the advisor will provide a list of all recommendation made during the past twelve months. Past performance is not indicative of future performance.
Mott Capital Management, LLC (“Mott”) claims compliance with the Global Investment Performance Standards (GIPS®) and has prepared and presented this report in compliance with the GIPS standards. Mott has not been independently verified. The Thematic Growth Composite is a blend strategy of different market capitalizations, which is approximately divided equally among three sectors. The Core Growth sector includes large multi-national companies, the Growth Sector includes mid- to large-cap companies, and the Aggressive Growth sector includes small- to mid-cap companies. The strategy is concentrated, and typically includes approximately 20 positions, and 5% cash. The strategy only invests in stocks, ADRs, and ETFs denominated in USD. The All-Cap Growth Composite was created June 2015. The S&P 500 is a free-float capitalization-weighted index of 500 large-cap common stocks actively traded in the United States. The index is shown as a general market indicator and may not reflect the same exposures as the composite. The investment management fee schedule for the composite is 2% on the first $250,000, 1.5% on the next $750,000, and 1.0% on the remainder. Actual investment advisory fees incurred by clients may vary. Further information regarding investment advisory fees is described in Part II of the firm’s Form ADV. Past performance is not indicative of future results. The U.S. Dollar is the currency used to express performance. Performance shown represents total returns that include income, realized and unrealized gains and losses. Net of fee performance was calculated using actual fees. Composite performance is presented net of foreign withholding taxes on dividends, interest income, and capital gains. Withholding taxes may vary according to the investor’s domicile. Policies for valuing portfolios, calculating performance, and preparing compliant presentations are available upon request. The annual composite dispersion presented is an asset-weighted standard deviation calculated using accounts in the composite the entire year. The 3-Year Standard Deviation represents the annualized standard deviation of actual composite and benchmark returns, using the rolling 36-months ended each year-end. The 3-Year ex-post Standard Deviation of composite and benchmark returns is not presented because the composite strategy has less than three years of history.