

12/16/20
Stocks – None
Macro – FOMC, SPY
Mike’s Reading The Markets (RTM) Premium Content – NOW WITH A 2 WEEK FREE TRIAL
- Post-Fed: Stocks Are Not Always The Sharpest Tool In The Shed
- Apple Seeing A Lot Of Call Selling – Morning Note
- Stocks Are Waiting On The Fed
- Stocks Up- But No Changes In Trend
- The Fed Is Likely To Underwhelm The Equity Market
- Options Volume Are Falling, Volatility Is Rising – A Bad Sign?
- Algos Playing Their Usual Games
- The Start Of A Busy Week
- Three Potential Paths For The S&P 500 Over The Short-Term- The Week Ahead
- Stocks Drop With More To Come?
Stocks rose some today, jumping by less than 20 bps on the S&P 500. The big action was the Fed at 2 PM. Everyone seemed very focused on the longer-for-ever stance and that QE forever policy. But interestingly, the Fed upped its growth forecast for GDP, inflation, and unemployment in the dot-plot. The equity market didn’t seem even to notice it. (Subscriber only video – Post-Fed- Stocks Are Not Always The Sharpest Tool In The Shed)
If that is the case, then perhaps rates on the curve’s long-end are too low, while the dollar is too weak. One would think that an improving economy would be beneficial for the equity market too. But the problem is that some of the stocks have gone up so much, and their valuations are so stretched on the low rate narrative that an improving economy will result in rates on the long-end rising. Sure the Fed has QE, but most of it is focused on the shorter end of the curve, giving the long-end plenty of run-way to increase.
The spread between the 10-Year and 2-year is 80 bps and could rise considerably more. In fact, the chart suggests it rises more. If the Fed will keep rates on the short-end pinned at zero through 2023, then it likely means any expansion in spreads will come from the long-end rising.
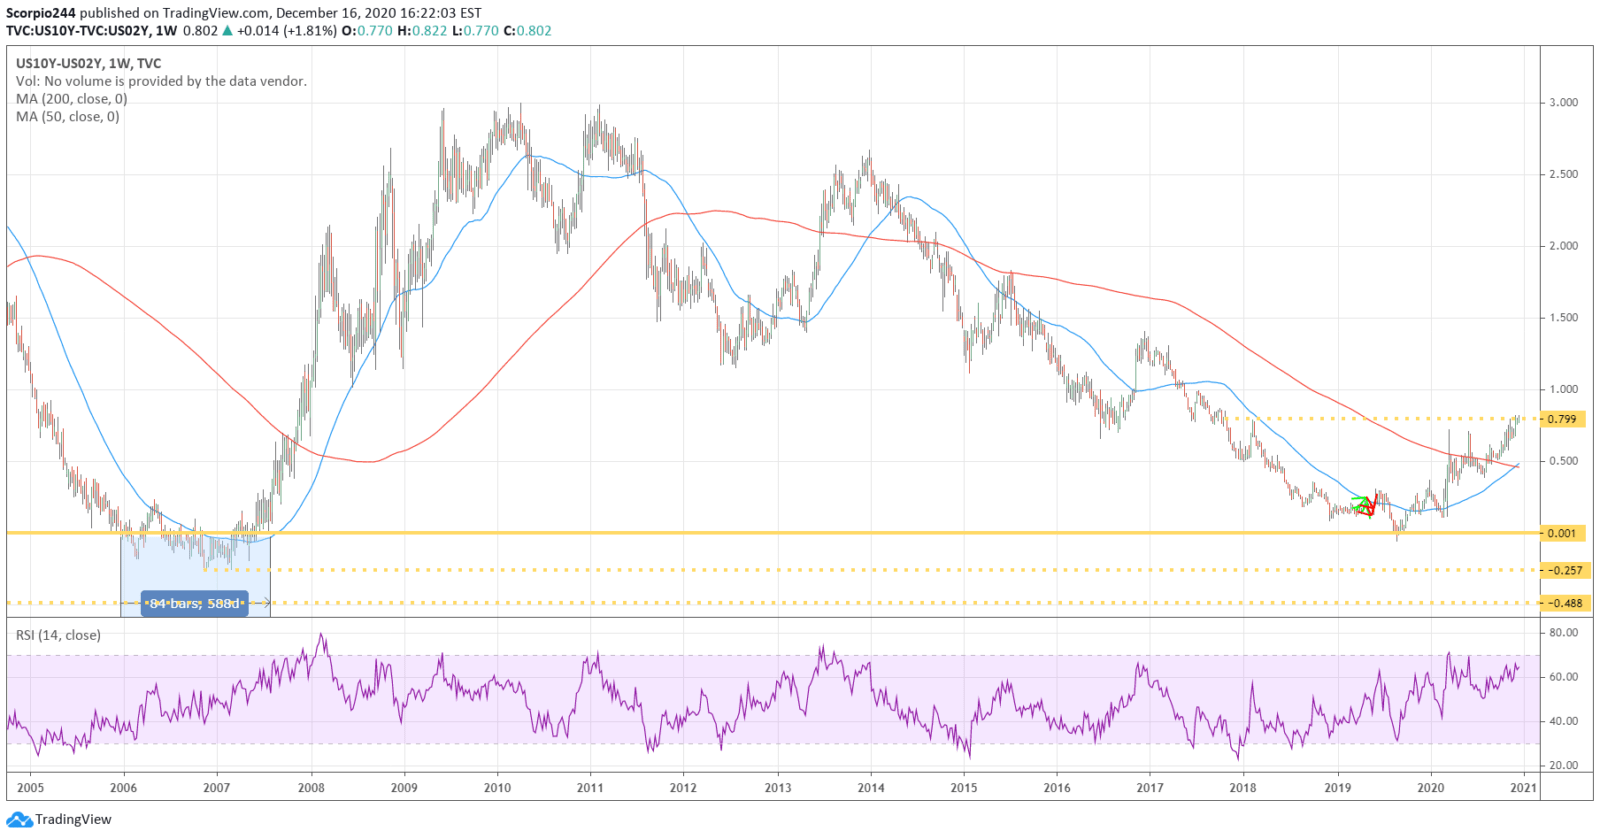
Anyway, something to think about.
It probably doesn’t matter right now; I mean, I keep reading how the S&P 500 is going to 4,000 by the end of 2020 and 5,000 in 2021. I don’t know where these numbers come from; they are thrown around as meaningless numbers; then maybe S&P 500 10,000 next year, why not.
In a Goldman note, I read that 61% of the 65% rally off the March lows in the S&P 500 has come in the overnight futures trading, with only 4% during regular trading. The report noted that much of this was due to positioning and hedging from daily option trading. It means that the stock market has now become a derivative of the options market. It means that the market’s rise is merely a result of gamma and delta hedging by the market makers.
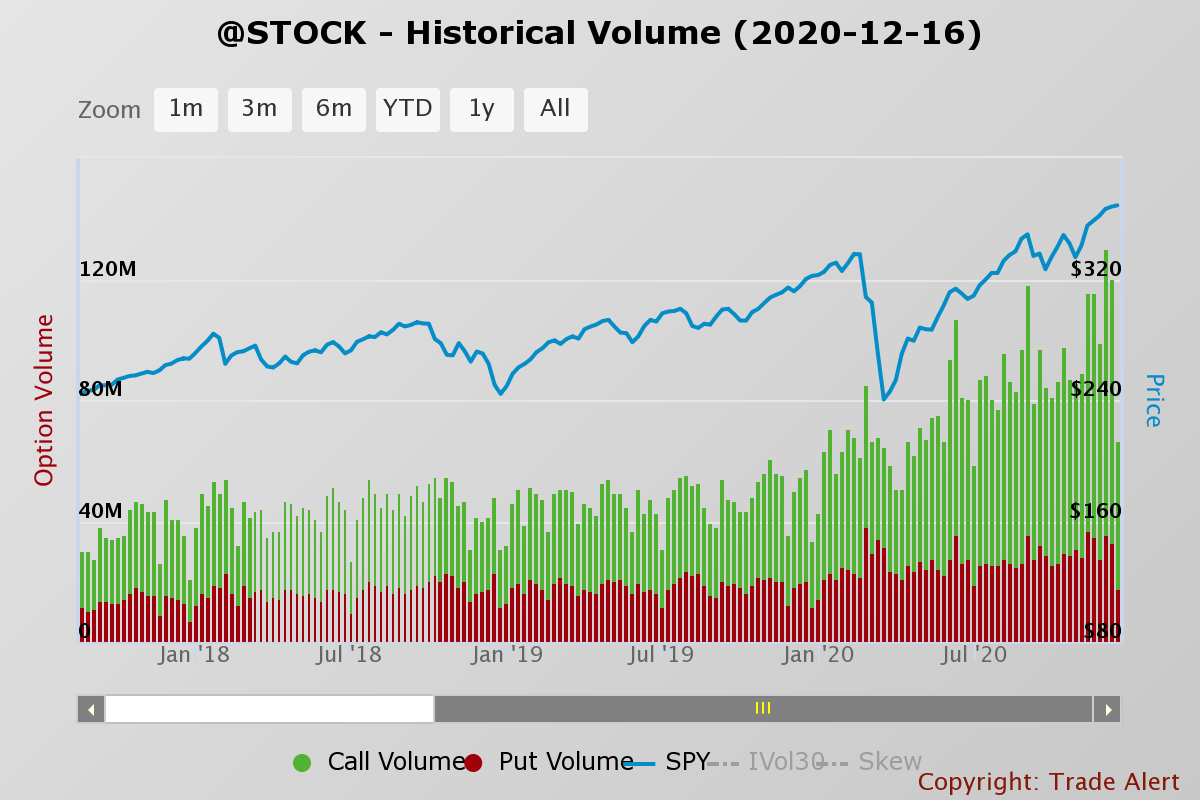
Options volume has nearly doubled this year from previous years, and in some cases, tripled. In fact, if you look at the chart, you can see the higher highs in the S&P 500 coincide with the higher highs in the options market.
The next chart is the average put to call ratio, and you can see the average is at historic lows.
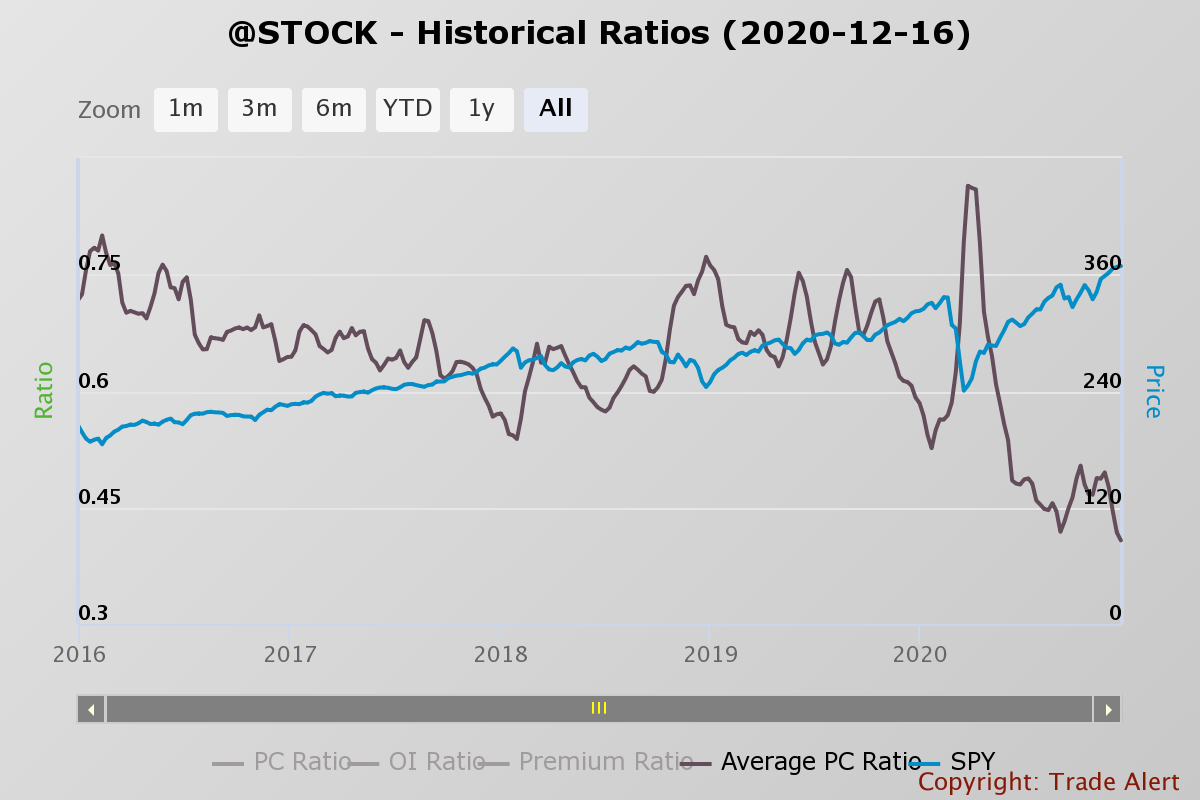
Reversion to the mean is something that not many of the newer masters of the universe know, but when they find out, they will not find it enjoyable; that is one thing I do know.
Anyway, no stocks today.
-Mike
Mott Capital Management, LLC is a registered investment adviser. Information presented is for educational purposes only and does not intend to make an offer or solicitation for the sale or purchase of any specific securities, investments, or investment strategies. Investments involve risk and, unless otherwise stated, are not guaranteed. Be sure to first consult with a qualified financial adviser and/or tax professional before implementing any strategy discussed herein. Upon request, the advisor will provide a list of all recommendations made during the past twelve months. Past performance is not indicative of future results.