|
|

|
|
|
   
|
|
Going to 2363 email Subscribers Daily!
|
|
|
|
|
|
|
|
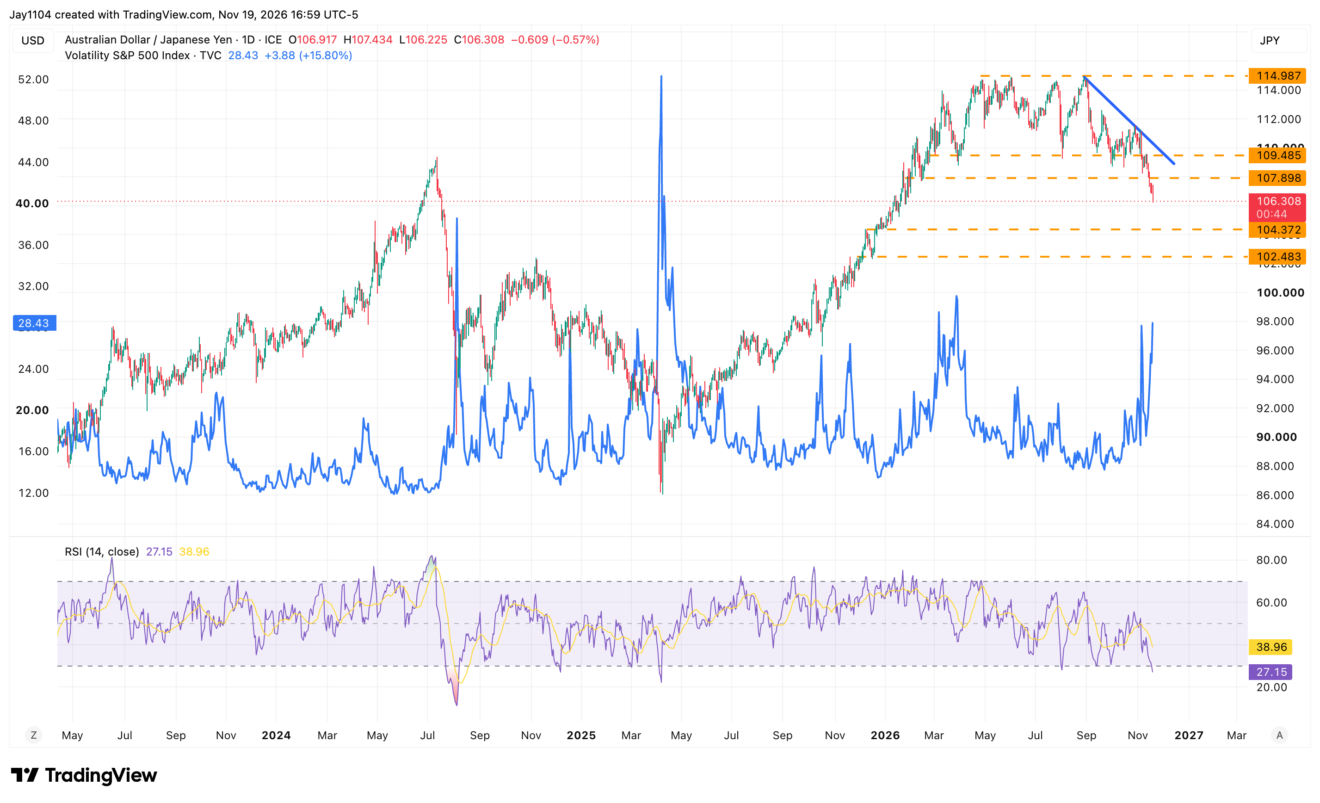
The S&P 500 broke critical support as stocks plunged, options expiration threatened additional downside, and weakness in AUD/JPY raised concerns about global risk sentiment and a potential yen carry trade unwind.
|
|
|
|
|
|
|
|
|
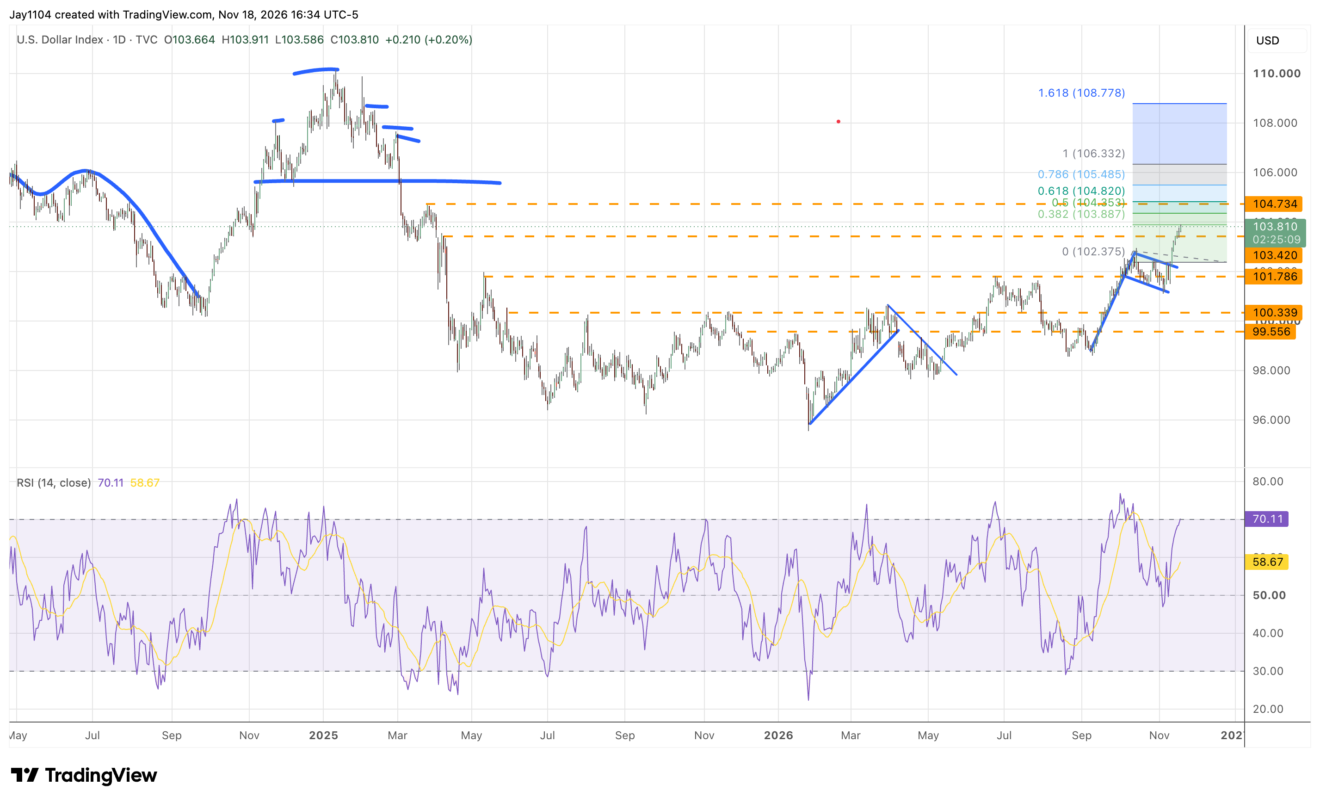
Stocks held key support levels ahead of options expiration as a strengthening dollar pressured gold, silver, and Bitcoin, raising questions about the next move in equities, interest rates, and liquidity.
|
|
|
|
|
|
|
|
|
|
|
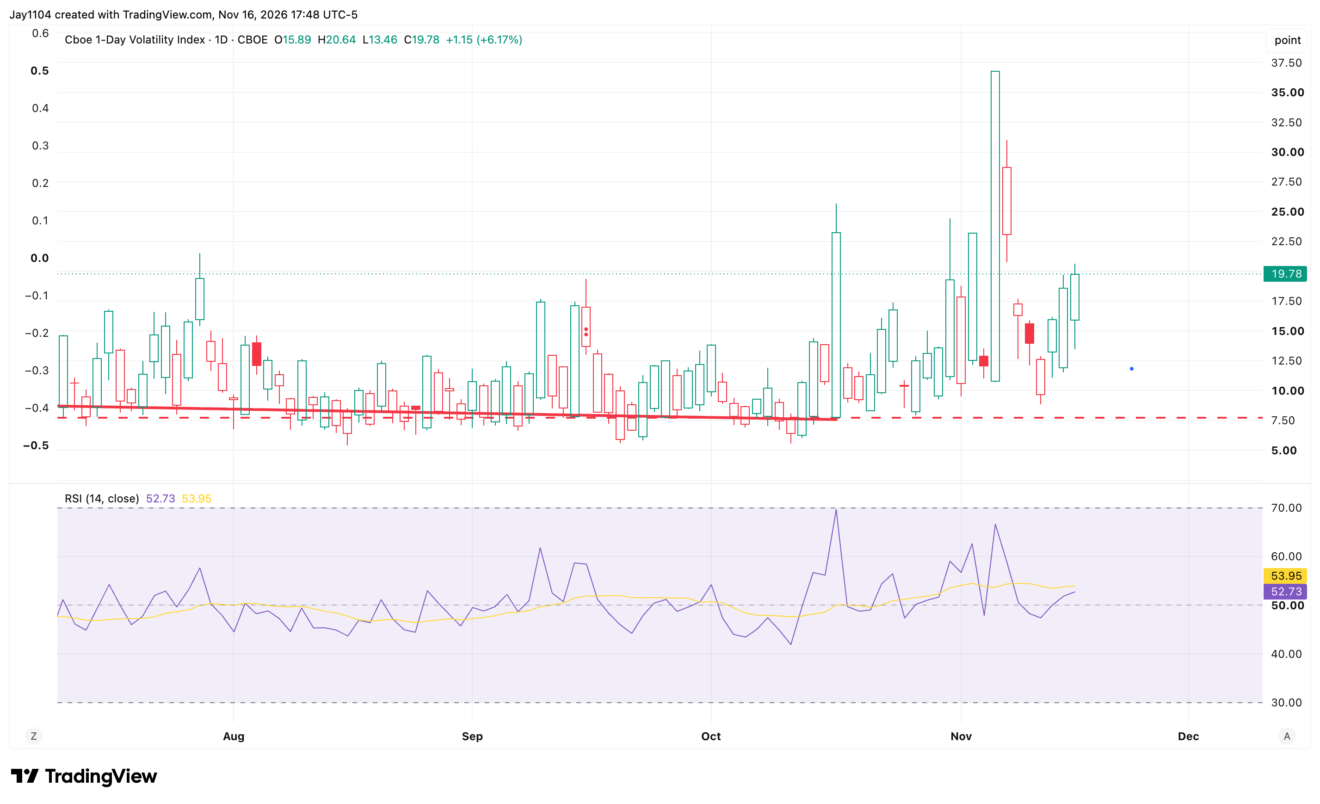
Nvidia's earnings spark a modest rebound as the S&P 500 tests critical support at 7,300 and elevated implied volatility sets the stage for a potentially sharp market move.
|
|
|
|
|
|
|
|
|
|
|
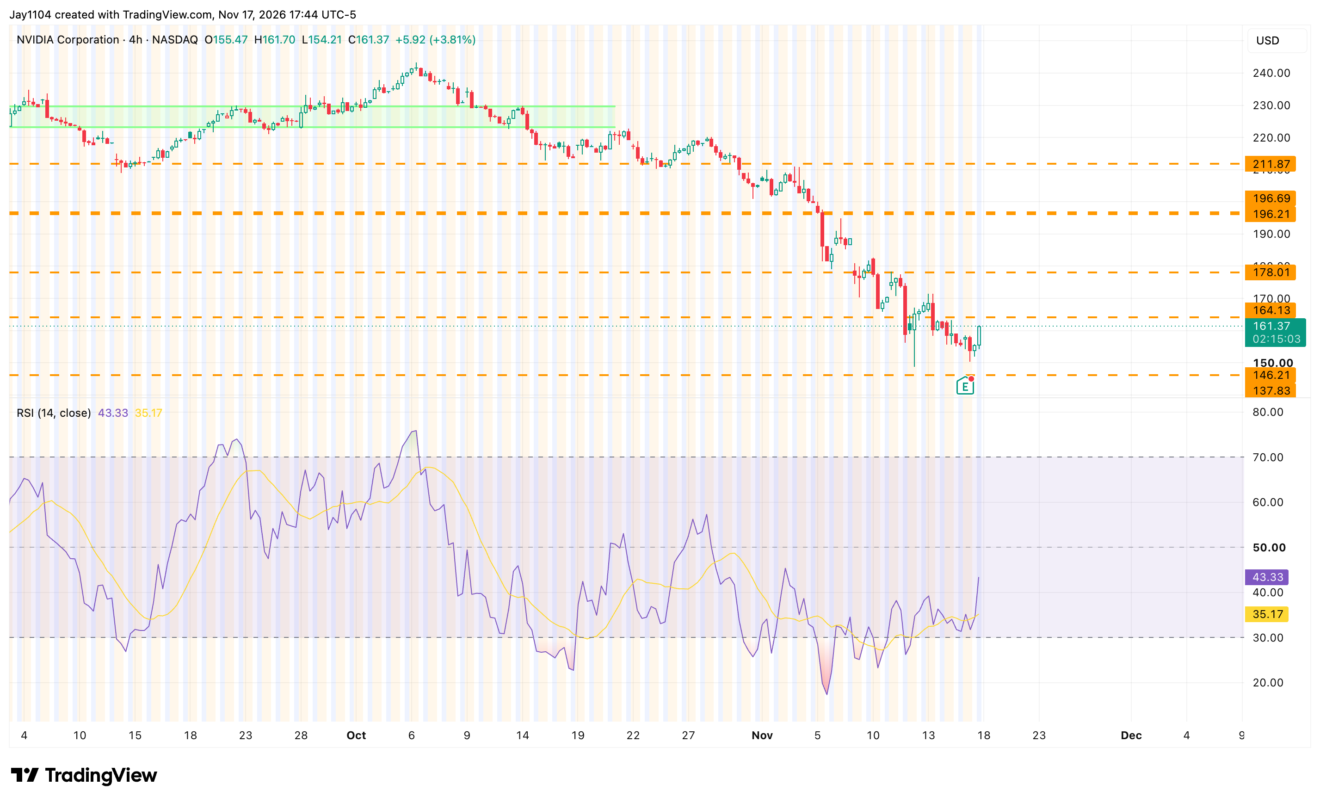
The S&P 500 and Nasdaq 100 plunged as Nvidia shares fell ahead of earnings, with bearish options positioning, a $150 put wall, and elevated implied volatility setting the stage for a potentially sharp post-earnings move.
|
|
|
|
|
|
|
|
|
|
|
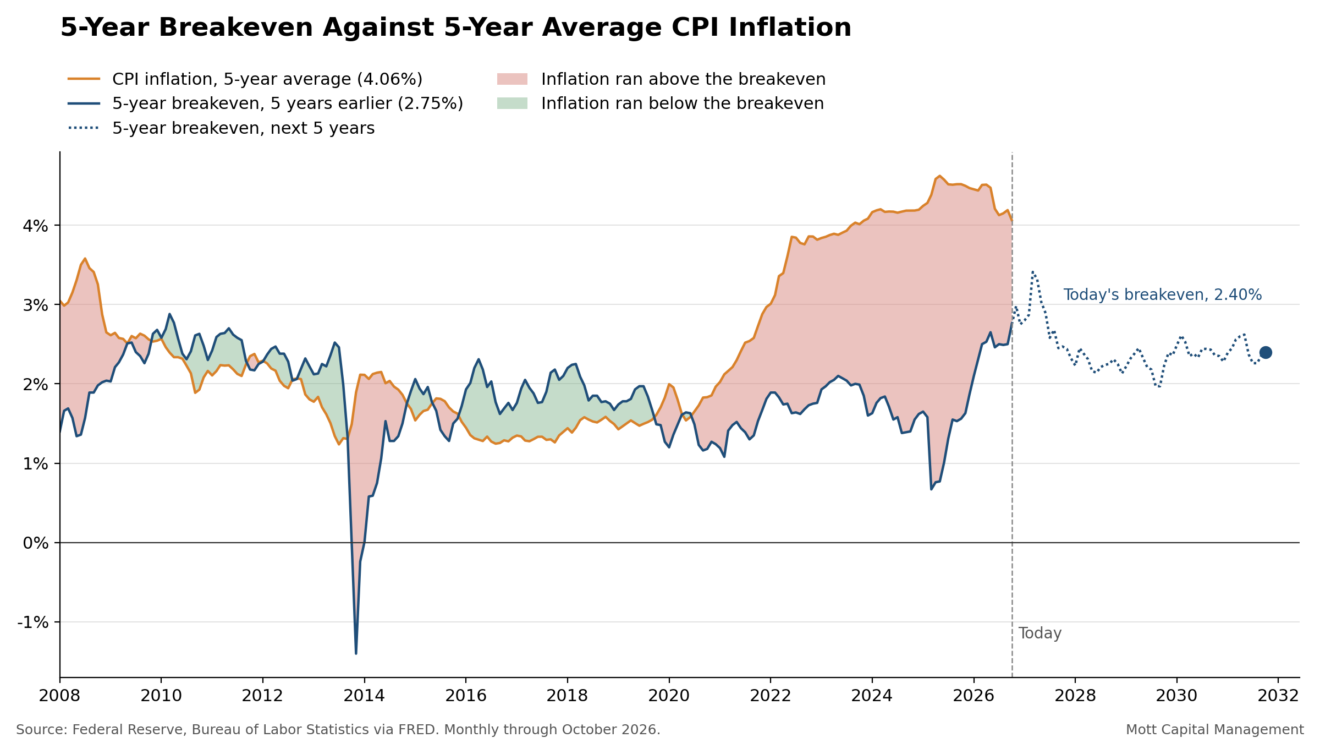
Markets are pricing in a steeper Fed rate-hiking cycle, but persistent inflation and historically low real interest rates suggest the Fed funds rate could ultimately reach 6.5% to 7%.
|
|
|
|
|
|
|
|
|
This report contains independent commentary to be used for informational and educational purposes only. Michael Kramer is a member and investment adviser representative with Mott Capital Management. Mr. Kramer is not affiliated with this company and does not serve on the board of any related company that issued this stock. All opinions and analyses presented by Michael Kramer in this analysis or market report are solely Michael Kramer’s views. Readers should not treat any opinion, viewpoint, or prediction expressed by Michael Kramer as a specific solicitation or recommendation to buy or sell a particular security or follow a particular strategy. Michael Kramer’s analyses are based upon information and independent research that he considers reliable, but neither Michael Kramer nor Mott Capital Management guarantees its completeness or accuracy, and it should not be relied upon as such. Michael Kramer is not under any obligation to update or correct any information presented in his analyses. Mr. Kramer’s statements, guidance, and opinions are subject to change without notice.Past performance is not indicative of future results. Neither Michael Kramer nor Mott Capital Management guarantees any specific outcome or profit. You should be aware of the real risk of loss in following any strategy or investment commentary presented in this analysis. Strategies or investments discussed may fluctuate in price or value. Investments or strategies mentioned in this analysis may not be suitable for you. This material does not consider your particular investment objectives, financial situation, or needs and is not intended as a recommendation appropriate for you. You must make an independent decision regarding investments or strategies in this analysis. Before acting on information in this analysis, you should consider whether it is suitable for your circumstances and strongly consider seeking advice from your own financial or investment adviser to determine the suitability of any investment.
|
|
|
|