

October 5, 2020
STOCKS – AAPL, SQ, AMD
Macro – SPY, TLT, LQD
Mike’s Reading The Markets (RTM) Premium Content – NOW WITH A 2 WEEK FREE TRIAL
- How To Find Technical Trends And Levels
- Re-Testing
- APPLE’S STOCK FACES FURTHER LOSSES BASED ON OPTIONS BETTING
- Stocks Point Higher As Monday Never Fails To Disappoint 😛
- 5 Themes For The Week Of October 5
- Bearish Pattern Persist, Lower Prices Likely -Midday
MICHAEL KRAMER AND THE CLIENTS OF MOTT CAPITAL OWN AAPL
Stocks shot up today, with the S&P 500 rising 1.8%, erasing all of Friday’s losses, and moving above last week’s highs. It was an impressive trading session. I don’t think that today’s price action takes the market out of the danger zone. It may have just delayed it.
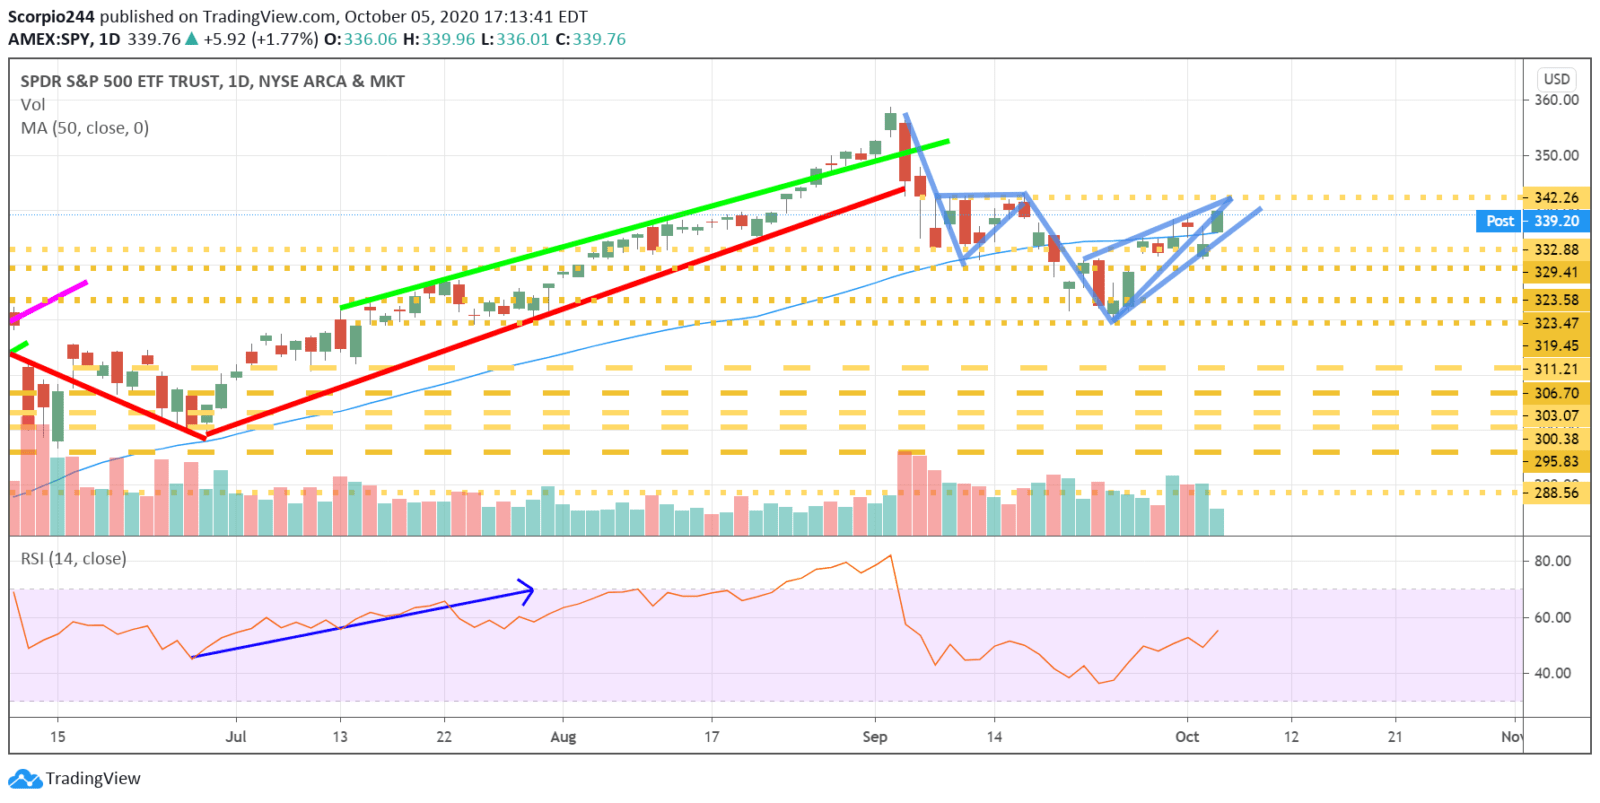
S&P 500 (SPY)
I’m still of the mindset there is a bear flag in the S&P 500 and across most significant stocks. I think it is just going to take an advance to 3,425 to find out if I’m right or wrong. It is, for whatever reason, a little bit more visible in the S&P 500 ETF SPY.
Volume levels in the SPY were pretty weak today, and that usually isn’t a sign of strength.
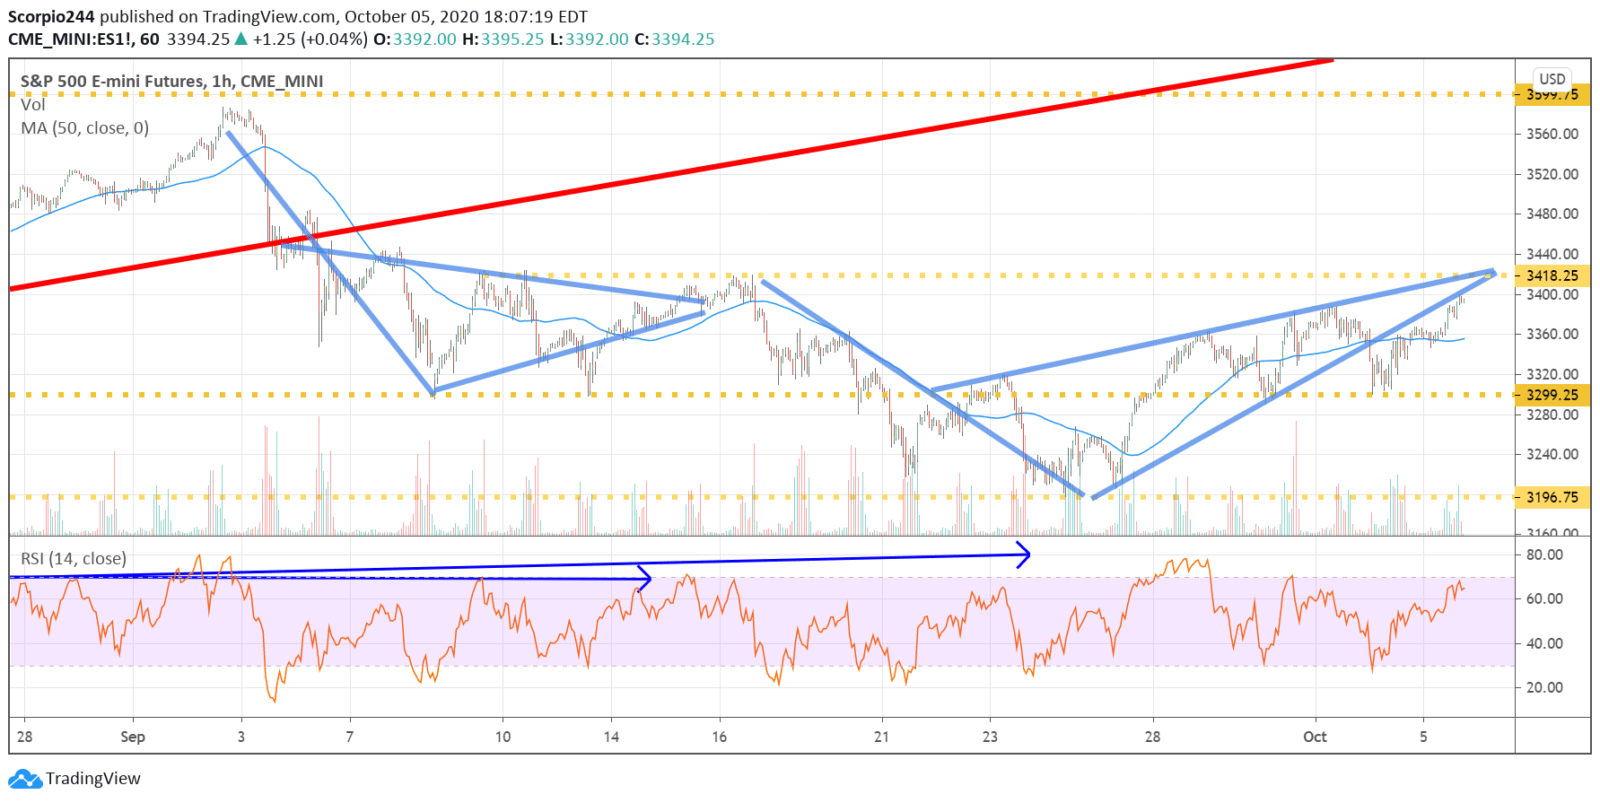
You can see the setup nicely on the S&P 500 futures. Again, this looks like a classic pattern for lower prices to me.
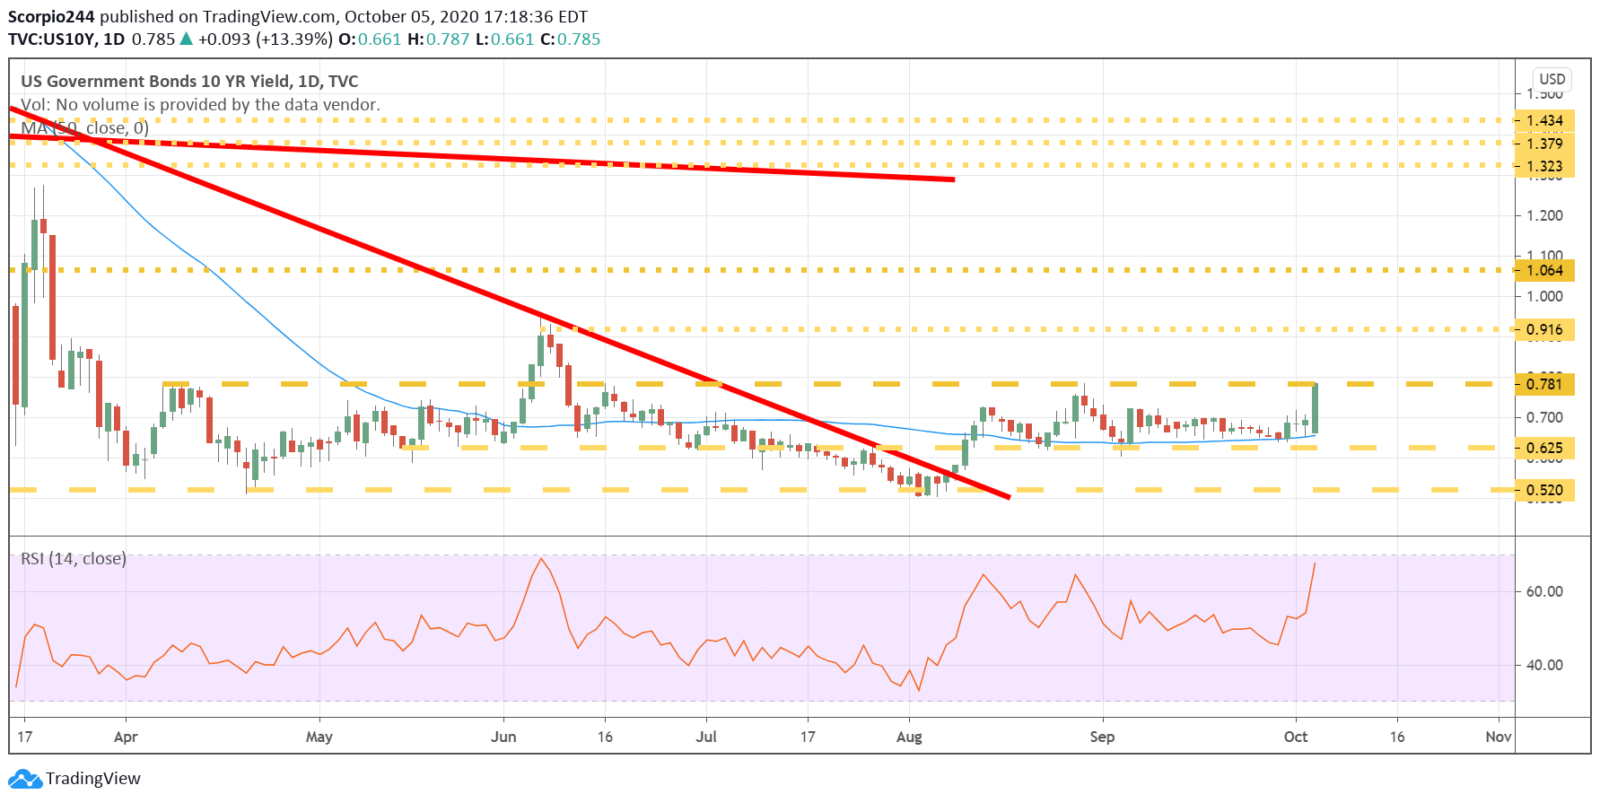
10-Year (TLT)
Rates did move higher, and it likely came on expectations of another stimulus, or the better than expected ISM report. The rate on the 10-year had a big move, up to 78 bps. It seems like we could be heading up to around 92 bps.
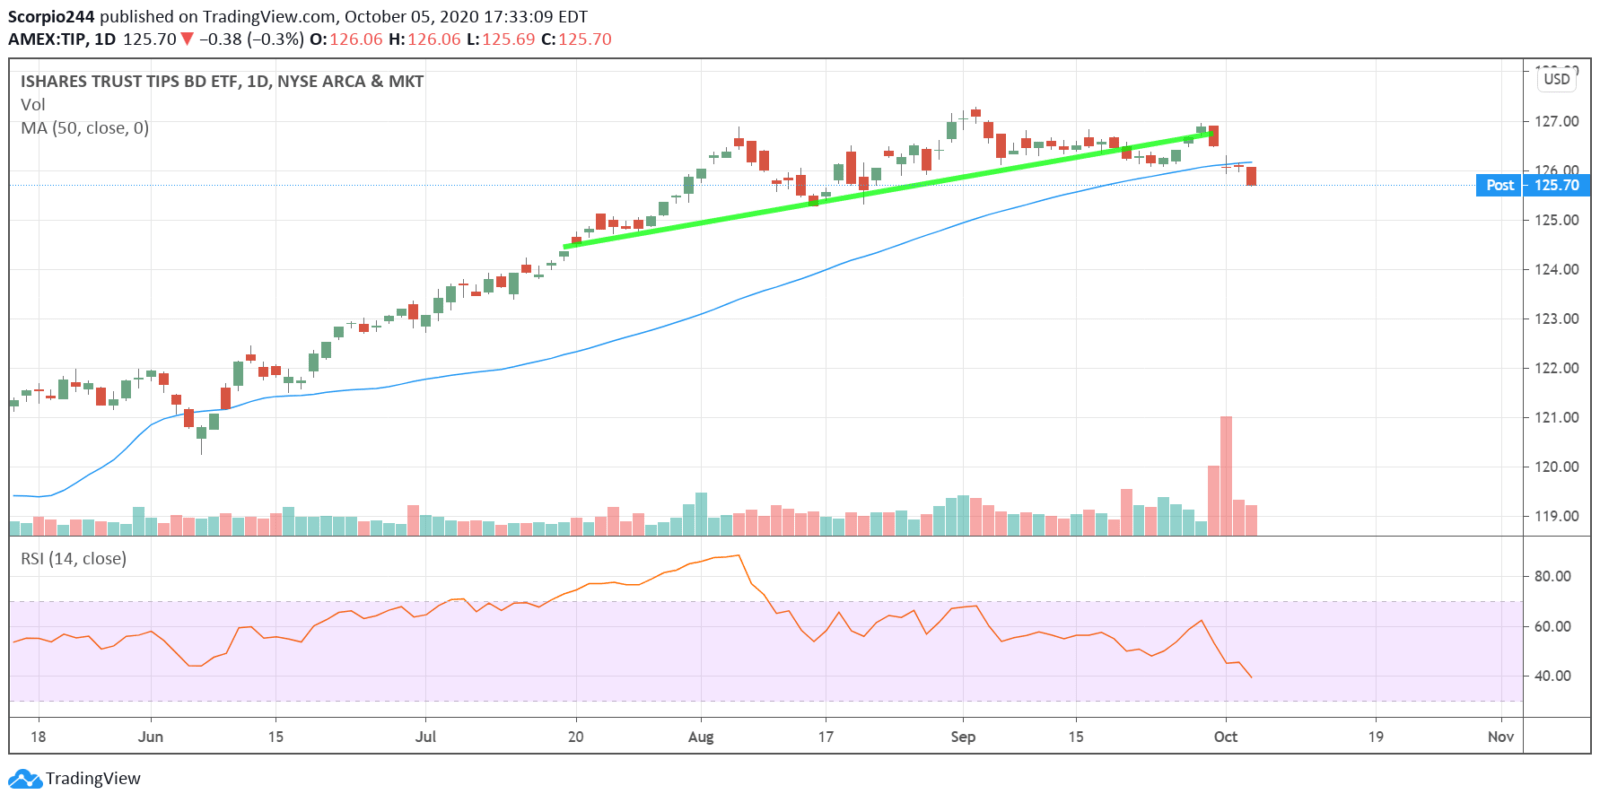
Tips (TIP)
Meanwhile, the TIP ETF fell below its 50-day moving average for the first time in some time. It is okay for the TIP ETF to move lower as long as yields are rising. If the TIP starts going more down, with yields unchanged, that would be more of a concern, at this point.
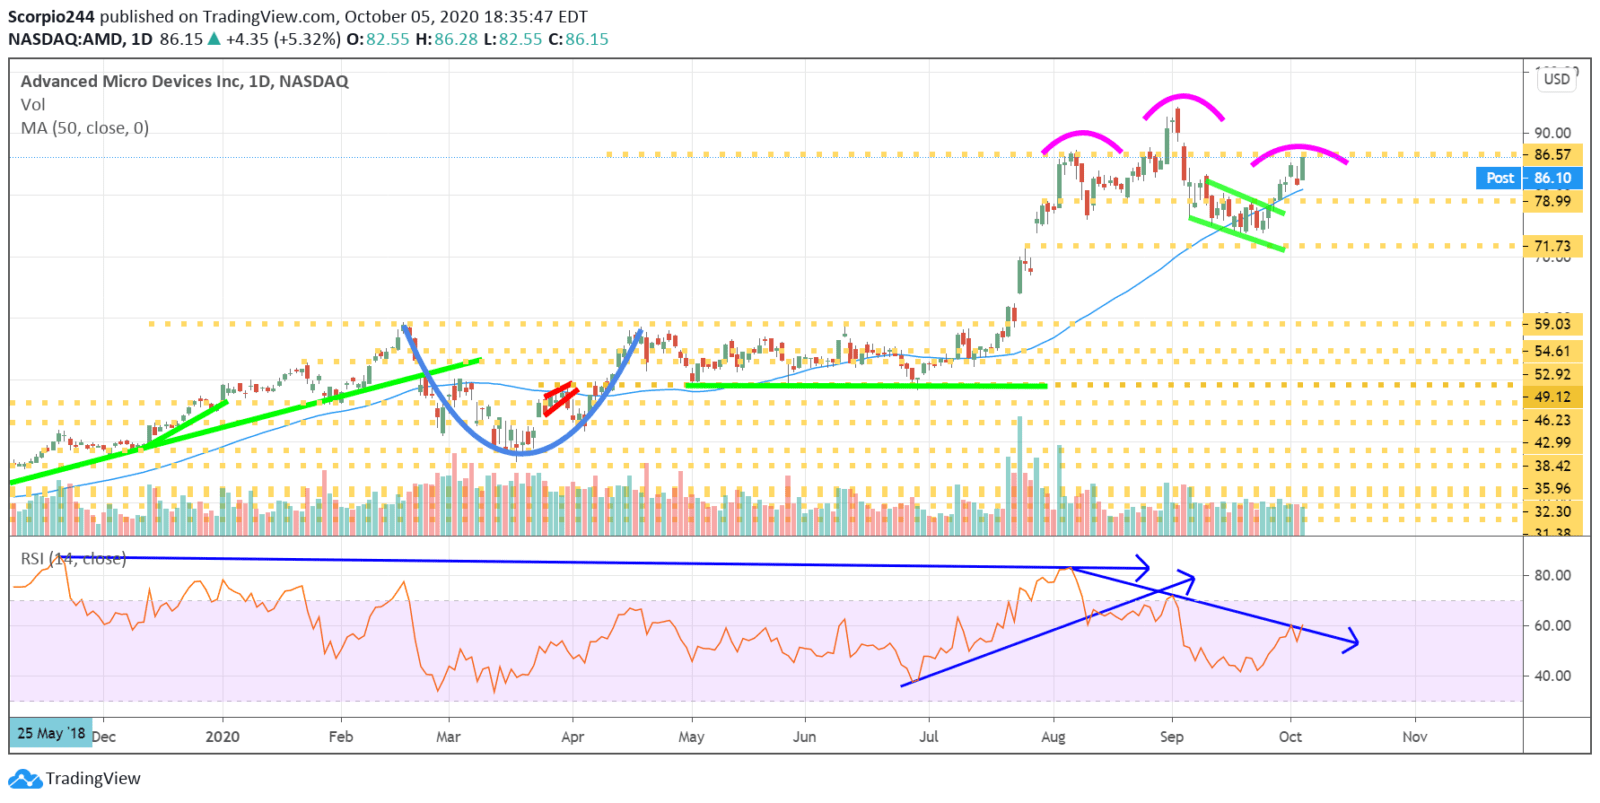
AMD (AMD)
AMD is potentially forming a head and shoulders pattern but would need to fall below $72 for confirmation. It is early to say for sure, and a jump above $87 would kill the pattern. For those that don’t know, a head and shoulders is a bearish reversal pattern. The RSI suggests momentum is leaving the stock, indicating lower price right lie ahead.
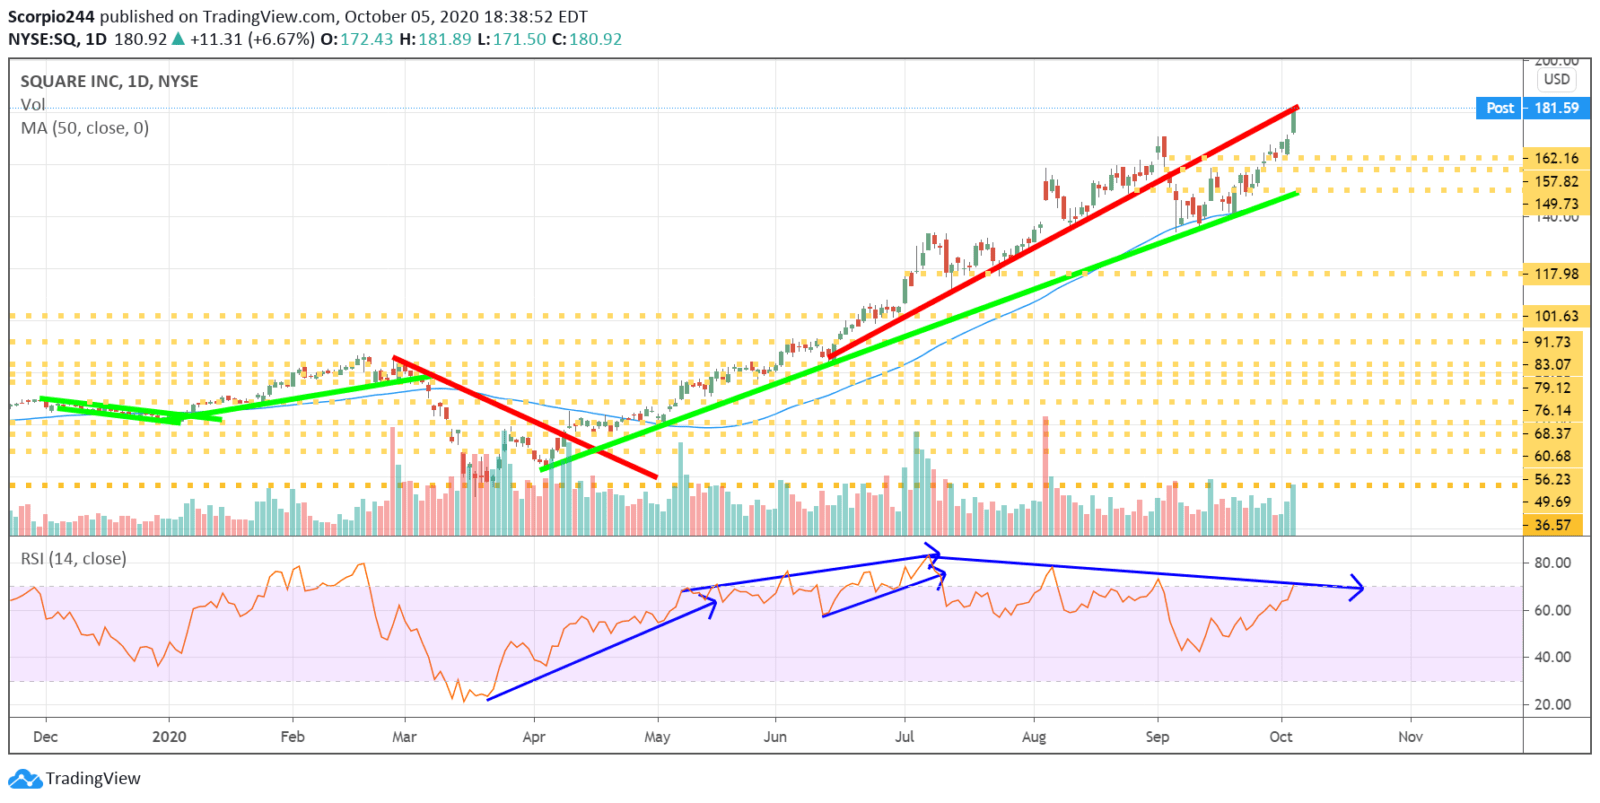
Square (SQ)
Square went right to $181.50, as discussed last week. The RSI is trending lower, and making lower highs, despite the stock rising. It is a bearish divergence and an indication the stock heads lower from this point on.
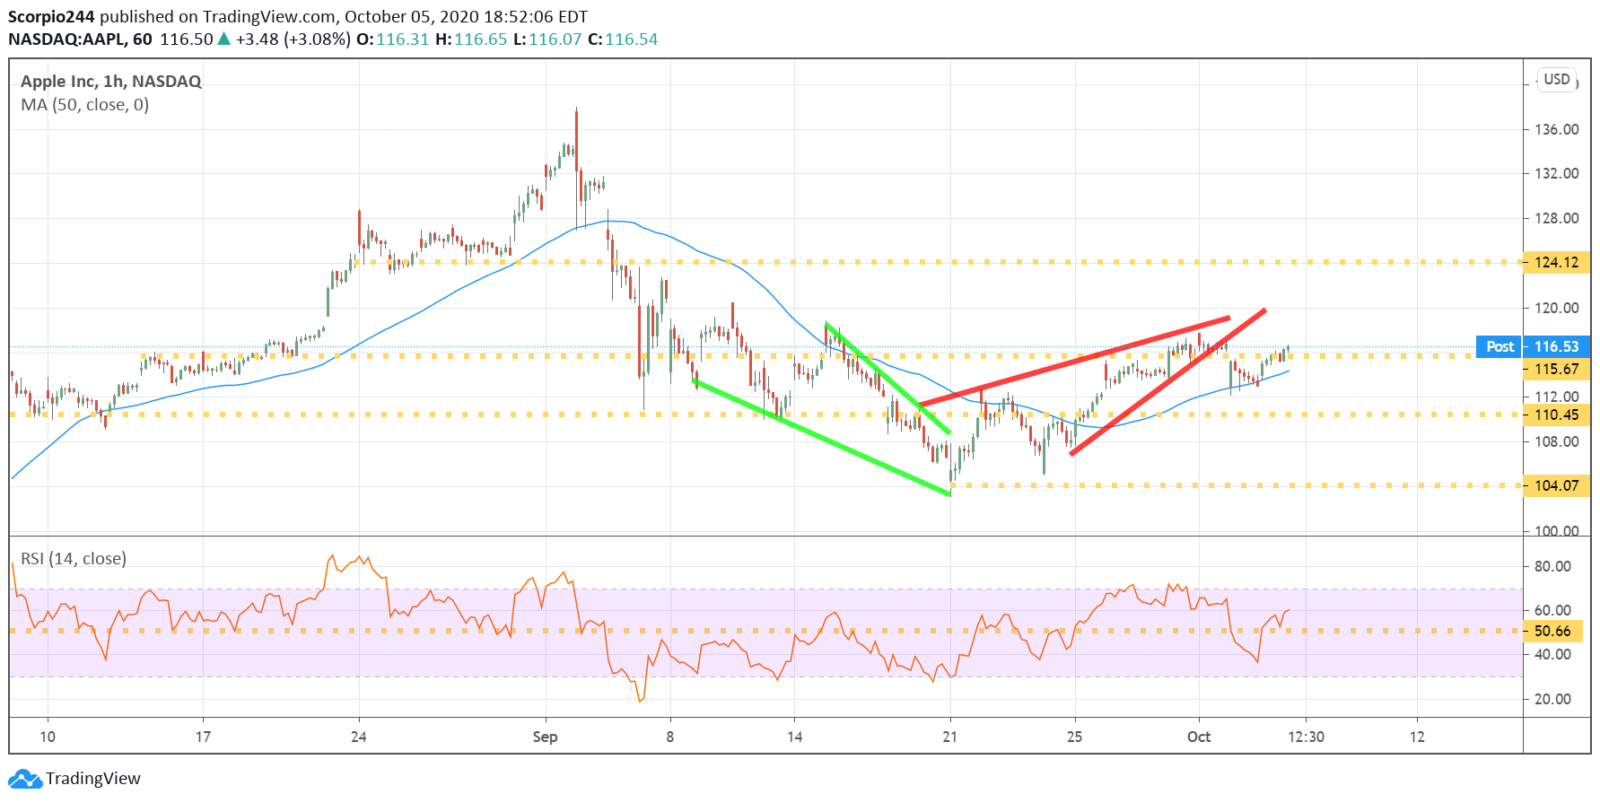
Apple (AAPL)
Apple had a massive option bet placed against it on Friday, which showed up in the open interest today. It suggests the stock falls in the week ahead, and the chart still supports those lower prices too. I have owned Apple for well over two years, and the long-term story is fine, but it doesn’t mean that the stock can’t go down over the short-term from time-to-time.
-mike
Mott Capital Management, LLC is a registered investment adviser. Information presented is for educational purposes only and does not intend to make an offer or solicitation for the sale or purchase of any specific securities, investments, or investment strategies. Investments involve risk and, unless otherwise stated, are not guaranteed. Be sure to first consult with a qualified financial adviser and/or tax professional before implementing any strategy discussed herein. Upon request, the advisor will provide a list of all recommendations made during the past twelve months. Past performance is not indicative of future results.