

[widget id=”text-19″]
This past week was not fun for anyone. The broader market volatility coupled with earnings made this particularly week brutal for some stocks. While other stocks notably were bucking the trend. This coming week has its own set of important events with more earnings, most notably Facebook and Apple.
It will also be a big week for economic data with more on inflation on Monday, followed by ADP Jobs data on Wednesday, and BLS Job data on Friday. The level of volatility is likely not to come down this week either. This data may very well be one of the key concerns for future earnings growth and the underlying cause for the recent stock market declines.
The VIX
When looking at the VIX, there is not enough fear in the marketplace. The current reading hit a high of just 27.5. The VIX hit a high of 29 on October 11 and hit a high of 50 in back in February. I know it is not comforting to hear this because the S&P 500 is already 9% off its highs while the NASDAQ is nearly 12% off its highs. It would suggest there is still more pain to come. I am looking for an intraday spike to around 35 on the VIX at some point to confirm a capitulation type of moment.
I do not think we will see the VIX hit its peak of this past winter, because there had been a few mechanical things in the market taking place surround volatility ETF’s and the unwind of a short volatility trade.

Put To Call Ratio
The Put to call ratio may also serve as a reliable guide, and that too confirms the theory there is more pain to come. In early February the S&P 500 put to call ratio hit about 2.75, yesterday it is was just 2.24. In February the total market put to call ratio hit 1.3, but it wasn’t until the end of March that it surged to 1.55. It was that March reading that marked the bottom in the Winter sell-off. Again, that suggests there is still more pain to come in this current downdraft until we can at least see the market stabilize. It took nearly a month after the stabilization before the market began to rise again.


S&P 500 Facing More Declines
The charts suggest 2,620 is the next level of support, but I think we may ultimately fall to about 2,575 before we see that bottom and stabilization. It sounds like a significant drop, but consider it is only a 3% drop from Friday’s closing price. Ten years ago that may have taken a few days, today it seems like just a morning’s worth of trading. Based on the current trends and pace of declines, it could happen by October 30 at 2:30 PM, this is a complete guesstimate.
Earnings Growth Remains Strong
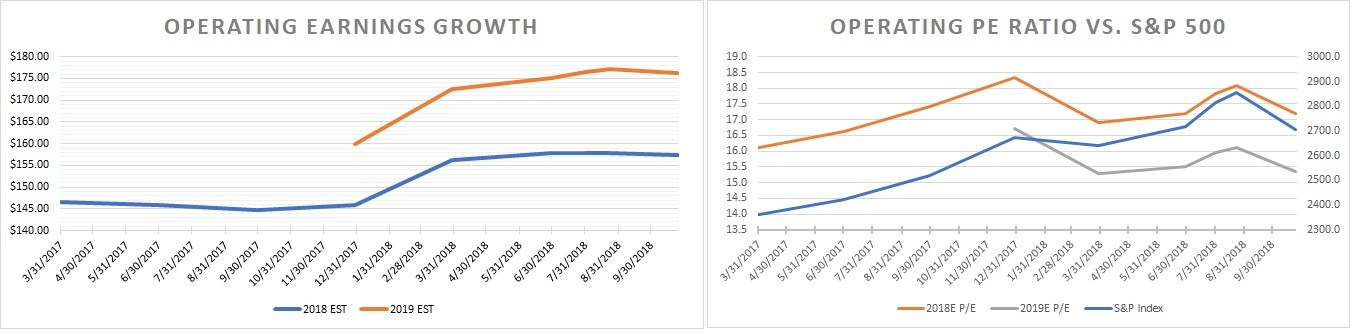
There is some good news in all of this because the PE ratio for the S&P 500 has fallen to 15.3 based on 2019 earnings estimates. Dow Jones S&P Indices are projecting operating earnings of $176.36 per share for 2019. That projection has fallen by less than 1% since the start of the fourth quarter and is up more than 10% since the beginning of the year.
Still Strong
Additionally, despite many negative headlines, earnings have been relatively robust. Through October 25, 238 of the S&P 500 companies have reported results. 77.3% have topped estimates, while 15.1% have missed, and 7.5% have met. Although the number of companies beating has declined by about two percentage points from the second quarter, that has merely gone into the met column. The number of companies missing estimates is unchanged.

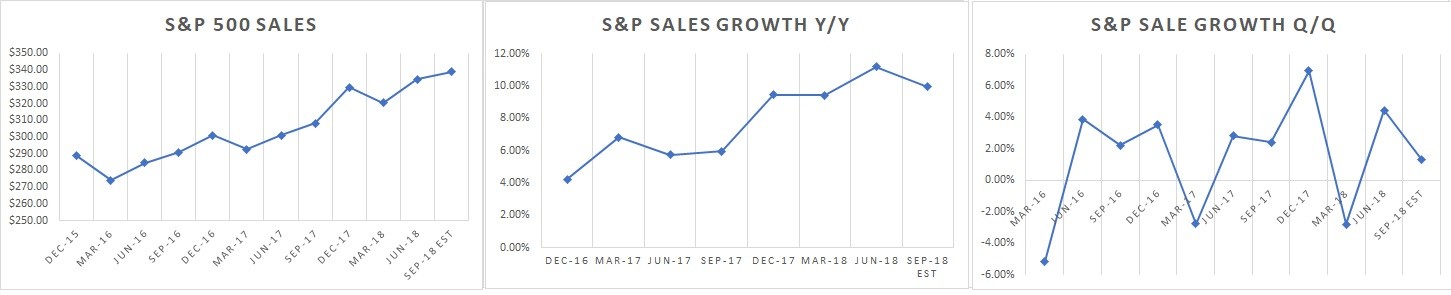
Strong Sales
Sales growth is also expected to be strong rising by 10% over last year and up by over 1% sequentially.
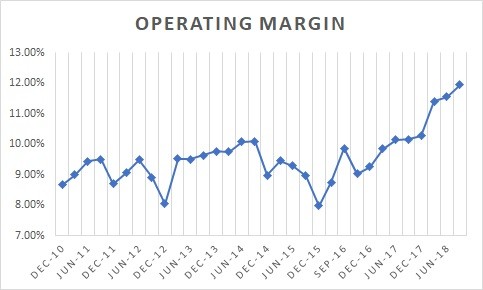
Margins
Operating margins have also been expanding and are at their highest levels going back to the year 2010.
Here’s The Problem
In that may lie the problem for investors causing this big scare. If operating margins are peaking and will to decline, then that may imply that earnings estimates for next year may be too high. Additionally, if sales growth is peaking, then that too would mean that earnings growth for next year may also be too high.

What to Watch
The best way to watch this scenario develop is to watch inflation rates, which factor into companies input cost and the US the and global GDP growth to determine sales.
One key concern has been labor, cost and that makes this week’s Job data a critical determination on the potential for further margin erosion.
Keep watching.
-Mike
Mott Capital Management, LLC is a registered investment adviser. Information presented is for educational purposes only and does not intend to make an offer or solicitation for the sale or purchase of any specific securities, investments, or investment strategies. Investments involve risk and unless otherwise stated, are not guaranteed. Be sure to first consult with a qualified financial adviser and/or tax professional before implementing any strategy discussed herein. Upon request, the advisor will provide a list of all recommendations made during the past twelve months. Past performance is not indicative of future.
S&P 500, SP500, NASDAQ, Earnings, Sales, Margins, volatility, vix